 Occasional Papers (2009-)
 Site Visualisations
The aim of this website is to provide maps and imagery which complement our understanding of the ancient world, and suggest new approaches to it. These maps include both "reference" material, with a minimum of interpretation (save in the selection of the sites themselves and the manner of their presentation), and also interpretative material such as reconstructed trade routes or cultural entities. Such maps are valuable tools of research and scholarship in all parts of the world, and have a cumulative value in demonstrating the wider contexts of individual areas. The website began with a focus on the Near East (western Asia), and within this on the Fertile Crescent, where farming and city life first began. An excursion to Peru provides an instructive New World comparison.
It would be possible to envisage a hierarchical structure of this kind, designed to cover relatively homogeneous units at each level, which together would provide a more comprehensive view of Eurasia. The entities would necessarily overlap somewhat, like maps in a conventional atlas, rather than form a rectangular grid of sheets, as in a map-series. It is worth sketching such a scheme, and its underlying logic, as a guide to planning future developments.
The western Eurasia larger framework of geographical units are as follows:
(Note that these names are convenient historical-geographical labels, which have no reference to current political entities and whose abbreviated titles may be misleading if taken literally.)
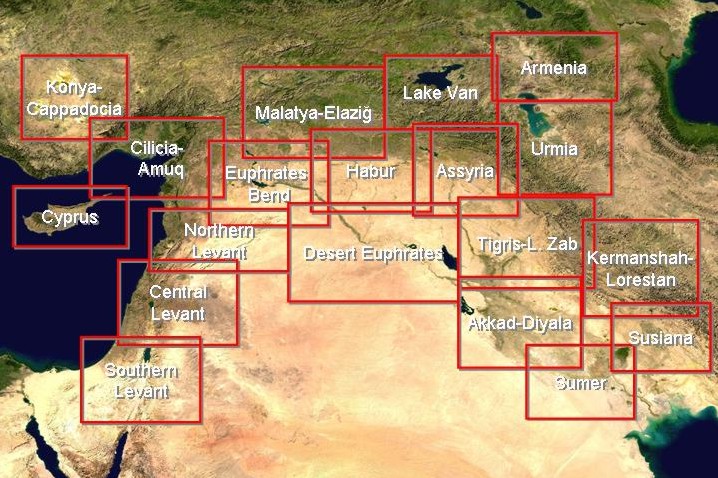
Zooming in, the Fertile Crescent can be further subdivided. The Fertile Crescent was a name given by J.H. Breasted early in the last century to the lands enclosed by the arc of the Tauros and Zagros mountains and the Levantine coast. It is one of the most critical regions on the Earth's surface, having given rise successively to farming, urbanism and statehood, maritime trade, the first land empires and several world religions.
A more comprehensive scheme could be envisaged as comprising four major levels, each with its appropriate kind of basemap/imagery and with the notional scales of paper maps, viz.
- Global or hemispheric
- flat or stereographic views / BlueMarble
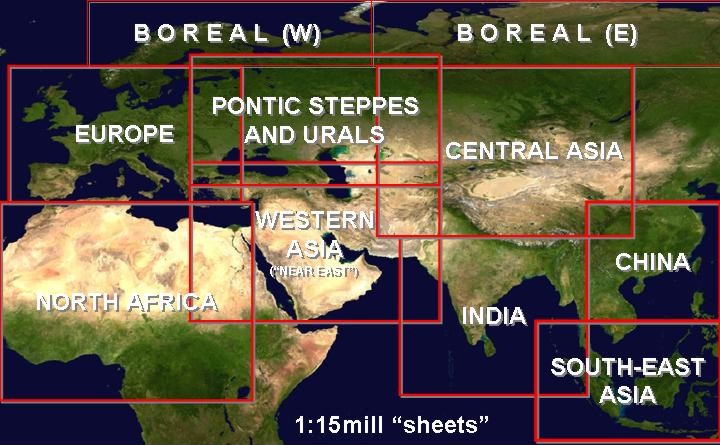
- Continental Units (eg Europe, Western Asia)
- circa 1:15 million / BlueMarble, 1km DEM
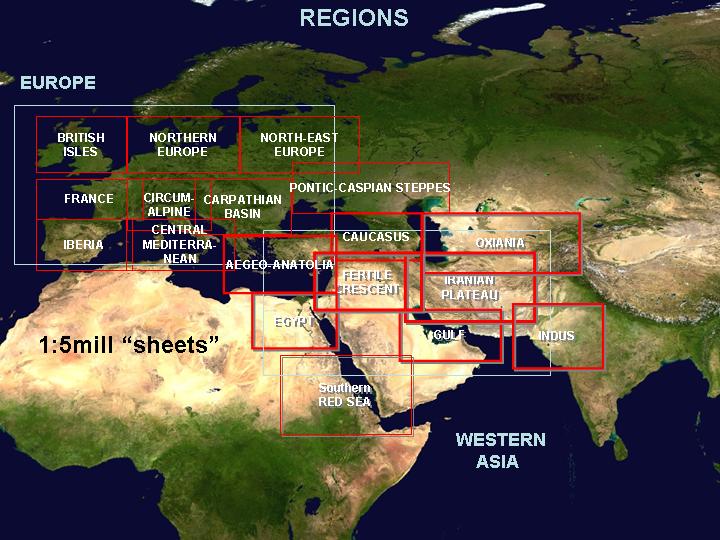
- Regions (eg British Isles, Fertile Crescent)
- circa 1:5 million / BlueMarble, DCW, 1km DEM
- Regional Windows (eg Sumer, Cilicia, Northern Levant)
- circa 1:1 million or greater / Landsat, DCW, 90m DEM, SPOT, IKONOS, etc.
A suitable layout for the largest entities below the level of the entire globe or hemisphere, which would preserve the integrity of the major historical arenas which it is convenient to map as entities in ancient times, would look something like the following:
Such a nested hierarchy of maps would allow major developments in different parts of the world to be represented cartographically through time, and compared on a variety of scale – either as parallel developments or as aspects of growing networks of inter-relationships.
The twin advantages of electronic representation, namely their ability to animate sequences in time and space, and to zoom between different scales of phenomena, could thus be used to their best advantage.

NASA