 Occasional Papers (2009-)
 Site Visualisations
For the most part, the study of large-scale trade and exchange in the ancient world remains distanced from the physical hardships of real human travel. Ancient trade or, more neutrally, ancient ‘interaction’ is often discussed as if it took place between actors who inhabited a flat and unchanging spatial surface. In fact, topography, climate and seasonality are essential to understanding the changing forms and intensity of human travel that enabled ‘interdependence’ between communities of the Near East.
In this exploratory essay I want to focus on two aspects of archaeological rhetoric: one textual and one visual, which together frame and inform our discussions of interconnectivity between highlands and lowlands. I ask you to forgive the fact that this is a rather preliminary foray into the topic of seasonality: nonetheless, I hope it might stimulate further discussion on how we might shift our practices to enable a more nuanced discussion of interconnectivity, interdependence and trans-regional exchange in the past and present.
Textual rhetorics
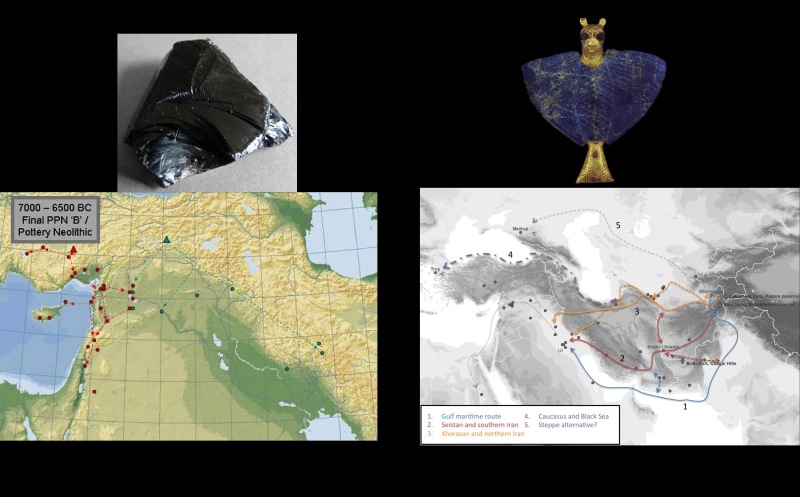
From an archaeological point of view, interconnectivity between highlands and lowlands of the ancient Near East and wider Eurasia is undeniable. The differential distribution of natural resources (particularly metals and precious stones which are sourced predominantly in highland regions), and the evidence for circulation of resources like obsidian (see [Sherratt 2005]) and lapis lazuli to lowland communities from at least the Neolithic—and to an apparently very large degree during the ‘Ubaid period—is the most obvious sign of this interdependence.
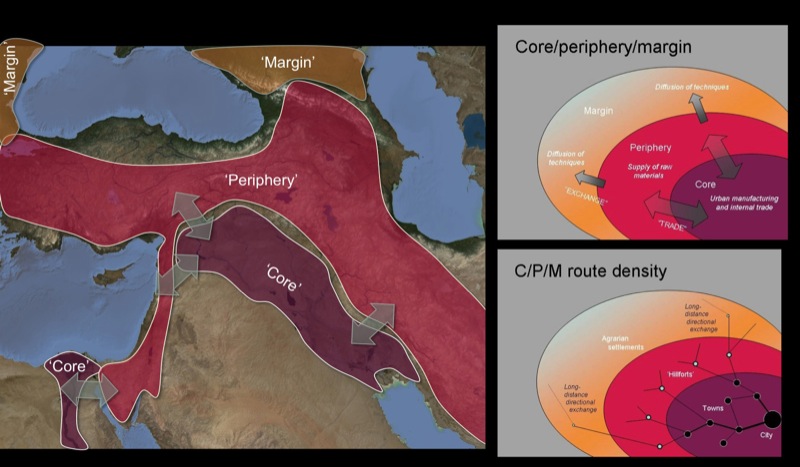
Our most successful models of this interdependence have tended to create abstract zones – consuming ‘centres’ and producing ‘peripheries’ – with highland regions normally characterized as ‘periphery’ (cf. [Sherratt 2004]). This is perhaps unsurprising given the urban perspective of our academic enquiry: we tend to remain urbanite office-nerds (bringing the city and its norms to the hills and tells, even when we venture into the field).
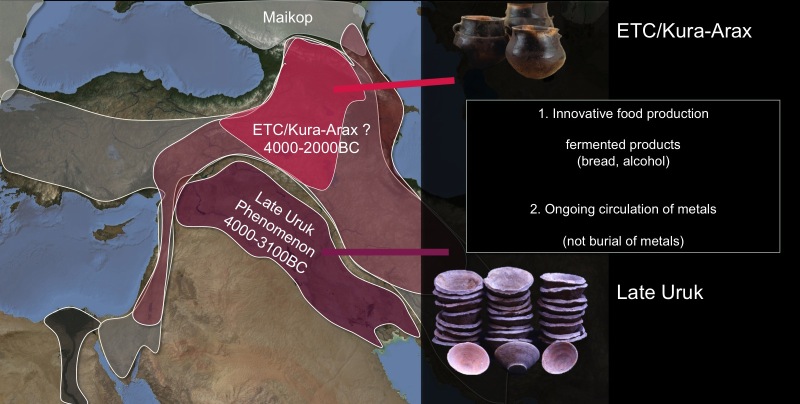
My interest in highland-lowland interdependence stems from a comparison of the trajectories of two well-known cultural phenomena: that of the (predominantly) lowland Late Uruk expansion (c. 4000-3100BC) and the (predominantly) highland Kura-Arax or Early Transcaucasians (c. 4000/3600-2000BC). I have argued recently ([Wilkinson 2014a]) that their respective economic histories were in some sense symbiotic but contrasting: for example the defining characteristics of both areas include using certain innovations in food production (perhaps especially fermented products such as leavened bread and alcohol) as central aspects of ritual or everyday life, but using different constituents (e.g. different crops) or using them in vastly different ways (e.g. in open roastings or in closed stews).
Additionally, a substantial degree of mobility (or nomadism) has been argued for both sets of communities, albeit characterised in different ways: Urukians are assumed to use donkeys to increase the reach of their trade networks and Kura-Araxians are assumed to travelled far for agro-pastoral or other reasons (eg. see Sagona 2013]).
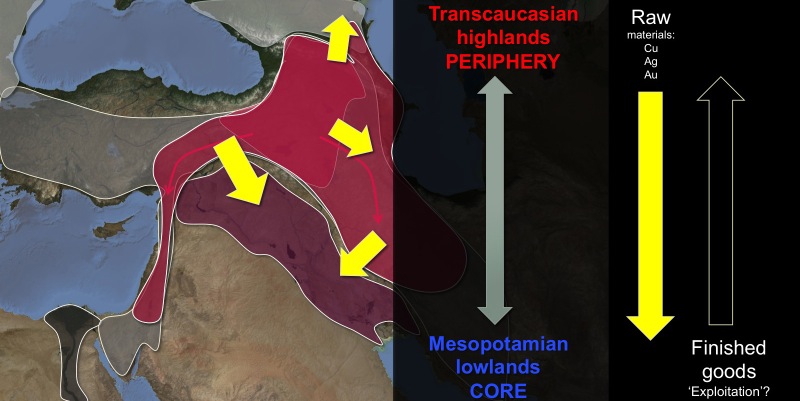
Classically, for example in a world-systems account, these two cultural entities and their topographic zones have been typified as representing assymetrical centre and periphery: in some sense interdependent economically and culturally, with the Mesopotamian (in this case Urukian) ‘core’ assumed to dictate the pace of technological innovation, amount of exploitation and degree of interaction or exchange. The basis of this centre-periphery interdependence is, in this case, metals travelling from highlands to lowlands.
But in the case of the Kura-Arax phenomenon—despite their Euclidean proximity and the on-going movement of materials [and people] undertaken between highlands and lowlands—forms of material culture and thus conservative life-ways seem to have been maintained very successfully for over a millennium, outlasting Urukian urbanism (sensu strictu) and even, after the collapse of the Uruk system, expanding beyond the Transcaucasian ‘homeland’ to Iran and the southern Levant.
Visual rhetorics (mapping movement)
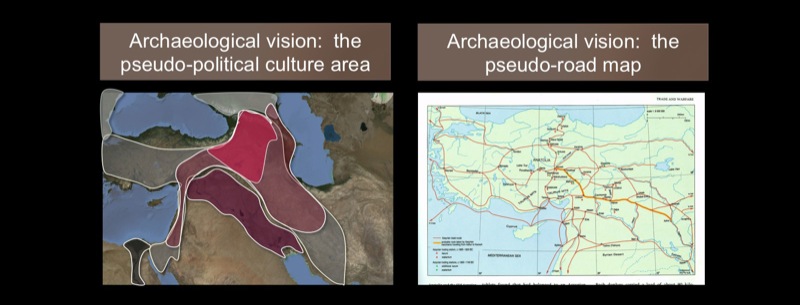
One of the barriers to moving beyond zonal characterizations of archaeological phenomena is our standard range of visual rhetoric or techniques of visualization. The trusty black-and-white line map has its place, but it also constricts our understanding of landscape (including topography, climate and seasonality) and the human movements that took place across them.
- Most representations of cultural zones are either dot-distributions or pseudo-political culture areas.
- Similarly, most diagrams of routes are basically ‘pseudo-road-maps’, devoid of all but the most basic topographic details.
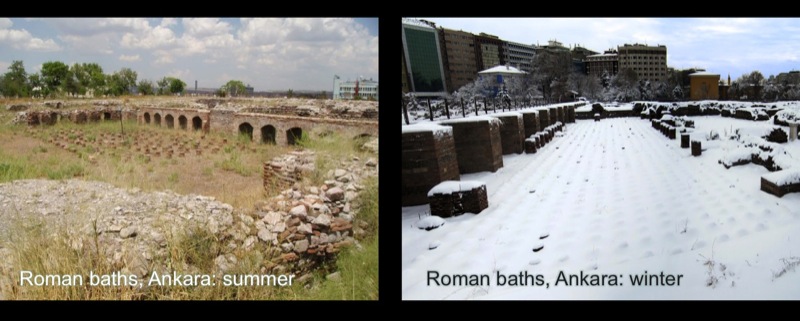
It is thus all too easy to forget basic ecological factors involved in movement and interaction along 'interdependence routes' — for example the fact that the places most archaeologists experience in summer, can be vastly different in character during the winter — affecting both low-level daily rhythms and larger-scale travels.
I use the term ‘interdependence routes’ to highlight the way in which communities come to rely on each other through geographic corridors of movement. In such situations, each community or each cultural zone relies upon relationships of exchange for essential aspects of social reproduction.
There are many kinds of seasonality relevant to interdependence routes. These mostly fall into two groups, solar or social:
- Solar:
- seasonality of resources: fish and fish roe (e.g. sturgeon), wool (e.g. sheep shearing times), crops (barley, wheat harvesting), snails (e.g. for purple dye),
- the related seasonality of activities: harvesting, mining, travel
- seasonality of travel: e.g. passes closed by snow (e.g. in Caucasus), heat preventing long travels (travelling at night in Central Asia)
- seasonality of resources: fish and fish roe (e.g. sturgeon), wool (e.g. sheep shearing times), crops (barley, wheat harvesting), snails (e.g. for purple dye),
- Social:
- seasonality of demand: festivals, religious events organized around calendars (haj, Christmas, weddings as organized by season/weather)
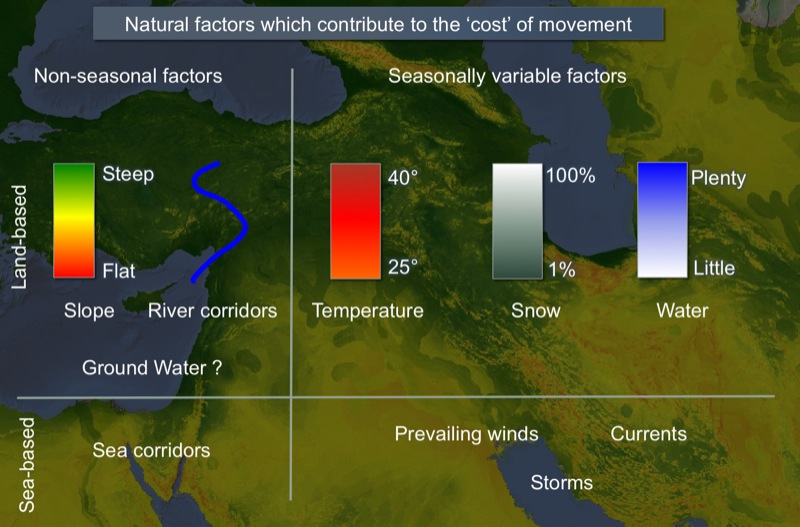
Each of these affect the ‘costs’ or ‘risks’ associated with travel and exchange but also their 'benefits' or 'profits'. When economists talk about ‘seasonality’ in modern markets, they refer to the opportunities for profit built into the disparity between demand and supply, in a sense between social and solar.

Despite this, the study of seasonality has normally been associated with issues of ‘subsistence’ or ‘transhumance’ rather than ‘trade’. Indeed, most studies of prehistoric trade are inherently anti-ecologic:
Physical landscapes are quietly ignored in the face of social models (e.g. world-systems, peer-polity etc. are essentially social-structural models and ignore or avoid geographic determinism);
Seasonal weather impediments are rarely incorporated into models, either because they add too much complexity or because of the relative shelter that most archaeologists have from the elements;
Seasonal demands on labour are rarely considered in the same context as ‘trade’ or ‘interaction’ (they appear instead under the domain of ‘subsistence’ or food/craft production).
The visual nature of archaeological maps showing routes of interaction hide seasonal ecological variables.
An Ecology of space (alternative visions)
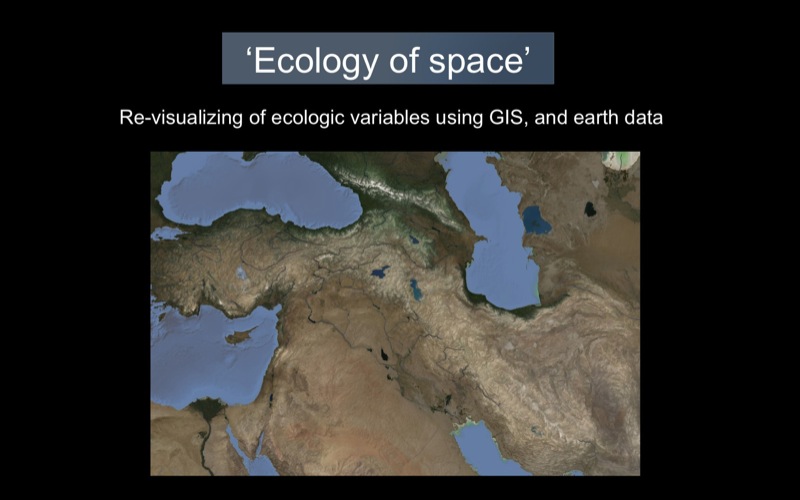
The approach I outline here focuses on experimenting with our practices of visualizing space and the interconnection between regions. We might call this approach an ‘ecology of space’.
Thanks to modern GIS, internet distribution and the generosity of the world's space and weather agencies, it is now possible to obtain detailed topographic, land-use and climatic data for most of the earth’s surface and then visualize and combine these data in any number of ways. Climate science models (including reconstructions of palaeoclimates) also allow us to simulate past conditions.
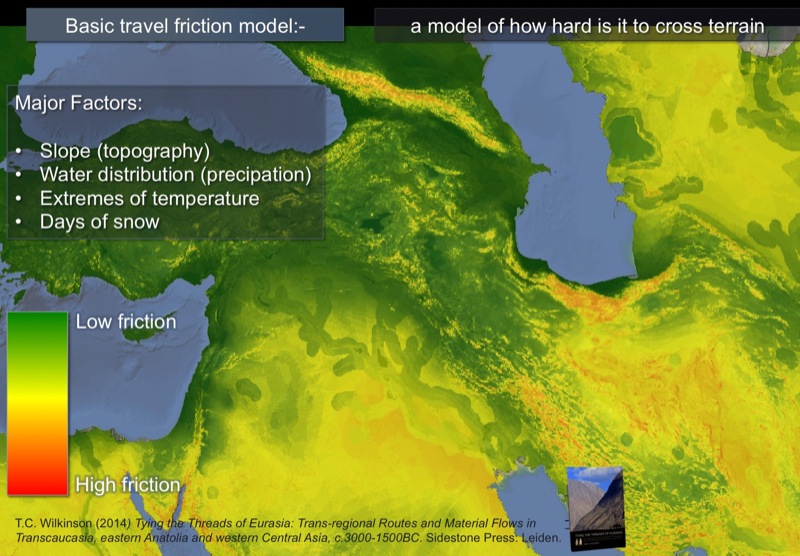
Friction or 'cost-distance’-based techniques can be used to create a heuristic model of ‘travel friction’ or 'travel cost' [Wilkinson 2014b], in order to visualize the relative distance of sites or the location of the most intense interaction for certain objects, once natural factors such as topography and water availability are taken into account.
Most models ignore seasonal variations, however, and rely instead on static ‘flattened’ or average data sources such as the total number of days snow cover and total precipitation which only provided me with cumulative costs across the whole year.
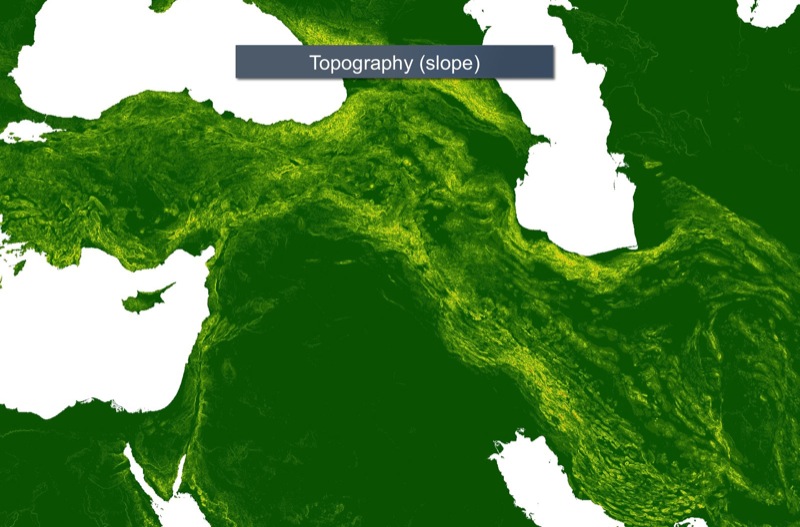
Topography or slope remains undoubtedly one of the most important and obvious barriers to travel.
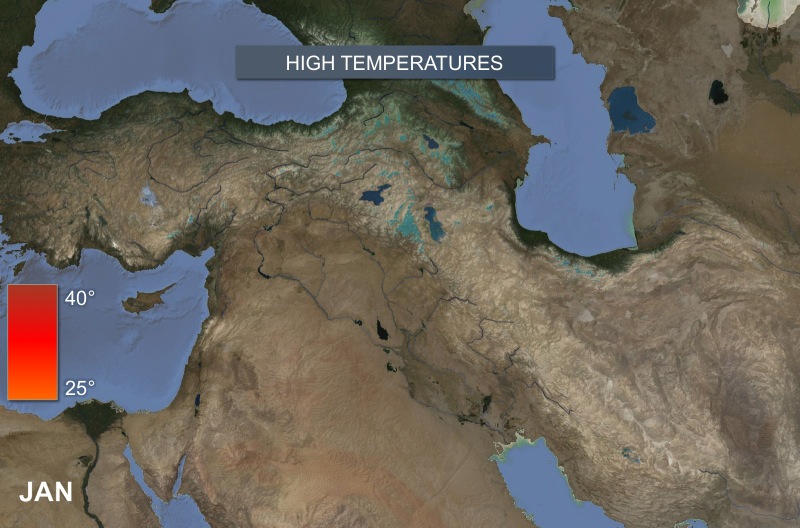
High temperatures present one seasonal source of additional cost to travel: it may be harder to force a donkey to carry goods in 40 degrees than in 20, though more often it is the human members of the caravan who are most heat-averse.
This animation shows a monthly sequence based on maximum temperatures of more than 25 degrees based on data from the WorldClim website which applies the CNRM-CM5 climate model to provide a prediction for maximum temperatures during the middle Holocene (i.e. c. 4000 BC).
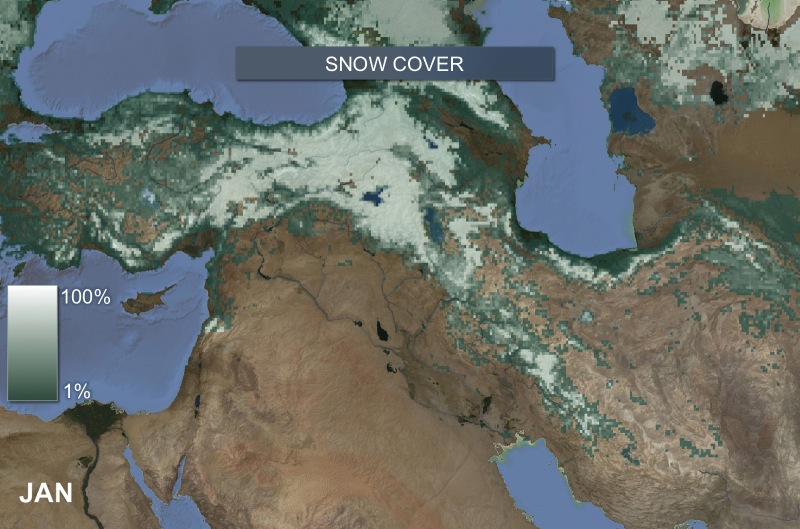
Snow is an even greater seasonal inhibitor of movement (exaggerating the topography of the landscape in which snow settles most commonly).
This sequence is based on the percentage of ground covered by snow in 2013 according to the Terra/MODIS earth observation programme from NASA.
(There is currently no easily useable ‘palaeoclimatic’ model of typical snow cover for earlier periods).
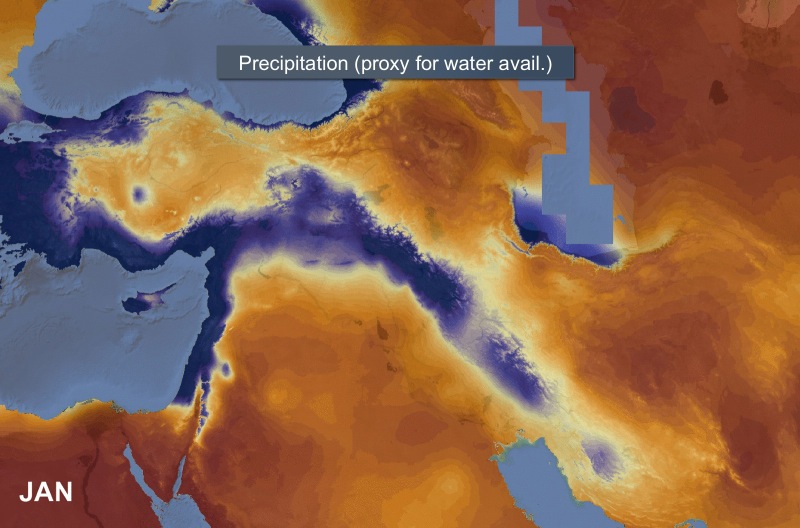
Accessible drinking water is the other major seasonal travel cost, but is one of the hardest to model realistically because it depends on the complex hydrological relationship between groundwater stores, precipitation, evaporation, river action and so on. Social systems (such as wells, springs and inns) are also used to overcome localized shortcomings.
Monthly precipitation as shown in the WorldClim mid-holocene dataset, seen here, can serve as a very crude proxy of seasonal water availability, but remains very far from representative.
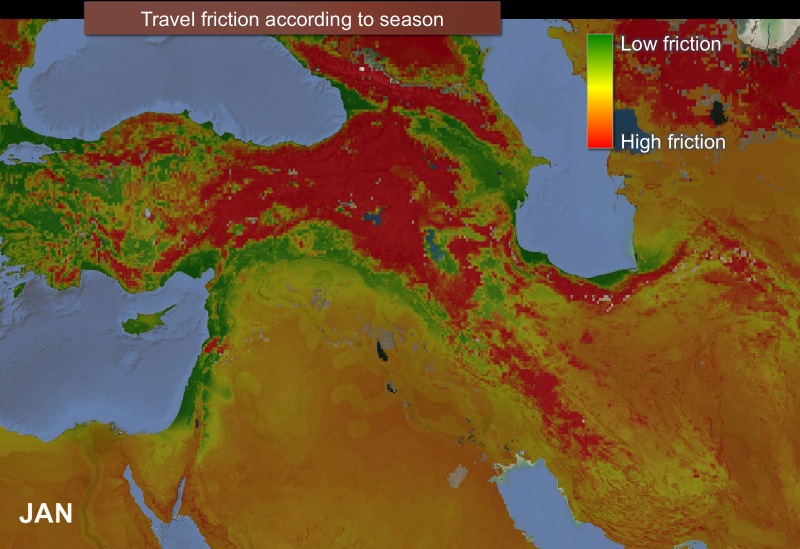
These animations are visually interesting by themselves, but how do we combine them together to assess the seasonal differences in travel opportunities over such wide areas? This slide shows a new combined sequence showing the seasonal variation in travel opportunity by merging my previous non-seasonal model, with a transformation of the effects of high temperatures and snow cover into ‘travel friction’. (Water availability has been left off for the moment for the sake of simplicity).
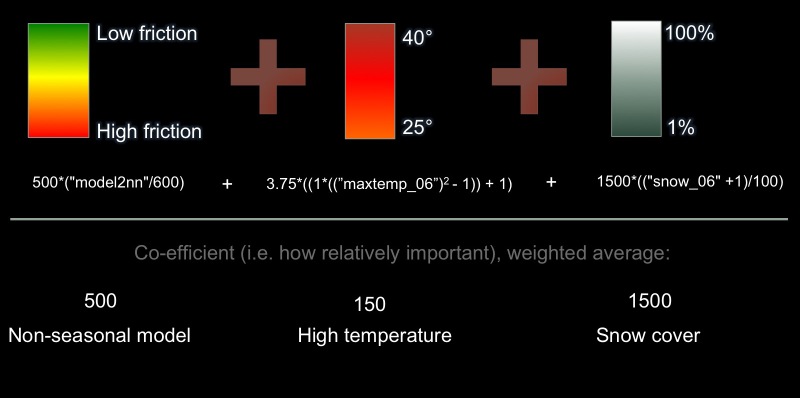
The exact way in which these factors have been combined is shown in this simplified ‘map algebra’. The relative importance of each factor is represented by a co-efficient. For the moment, these co-efficients are decided by trial and error: there is little if any experimental data which might tell us how important each factor is to human movement. Ethnographic data could provide us with some indicators, but to be able to give realistic values to these co-efficients, one would need a large programme to measure the relative travel costs quantitatively (in time or in energy).
It is important then to use this kind of modelling to ‘think with’ – to explicitly visualize our normally implicit expectations of what factors contribute to travel.
Rhythms of exchange
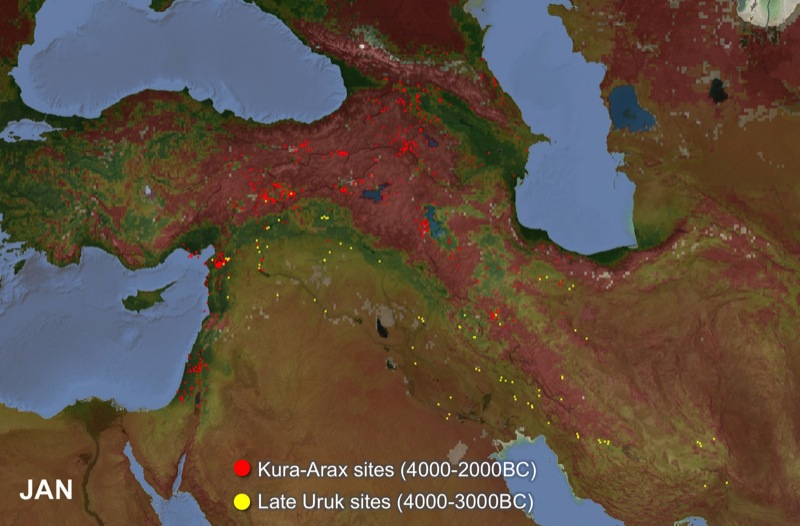
By plotting archaeological data over the seasonal model we can begin to re-relate large-scale archaeological patterns (including the Uruk and Early Transcaucasian phenomena) to ecological ones.
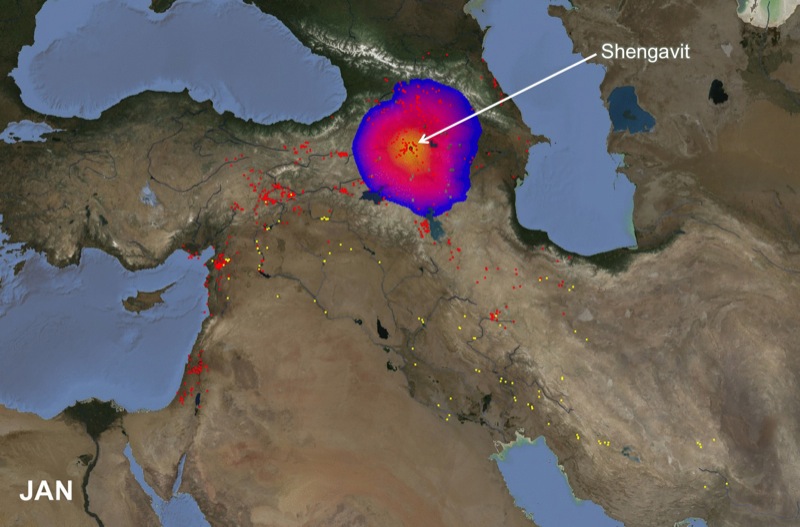
One way to use this is to consider the relative ‘reach’ of particular sites (in terms of effort to cross particular areas at certain time) in different seasons. If multiple sites or distributions are combined, we can also start to consider the changing seasonal density of travel along certain routes.
For example, this animation shows a model of the seasonal walking reach, of a maximum of 30 days walk, from the Kura-Arax site of Shengavit in Armenia, created using a set of ‘Path Distance’ analyses. (This particular animation suggests to my mind that the current configuration of the model is under-privileging the costs of topography).
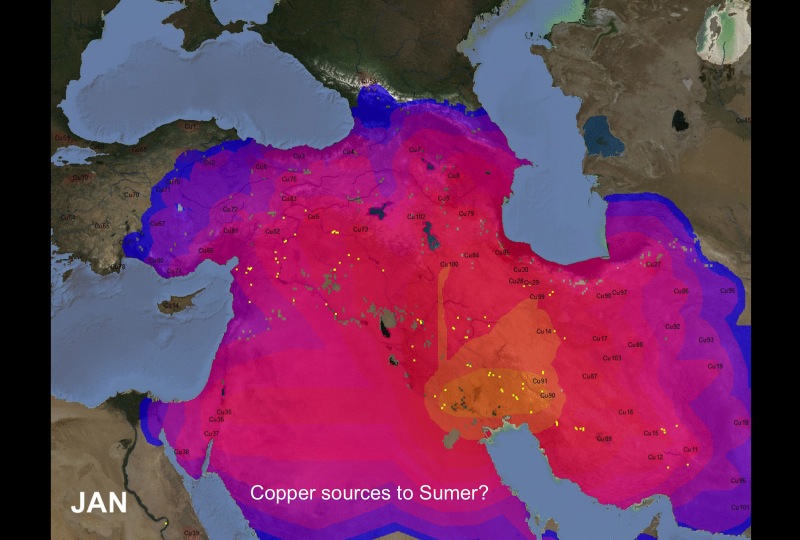
These kinds of analyses can also give us ideas about the temporal nature of access to resources, since significant travel may only be undertaken at certain times of the year.
This animation shows the relative seasonal accessibility of copper sources to Uruk using a corridor algorithm. This takes all known sources into account, so combining this data with provenance studies might give a more useful set of ‘corridors’ to work with.
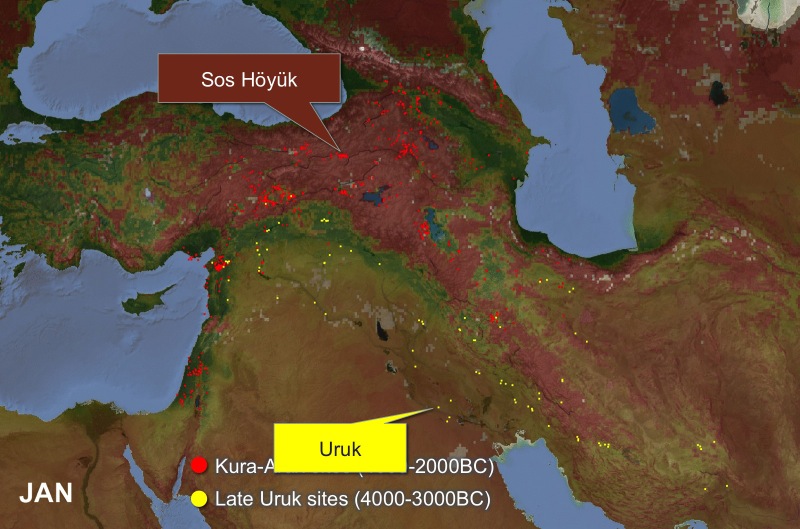
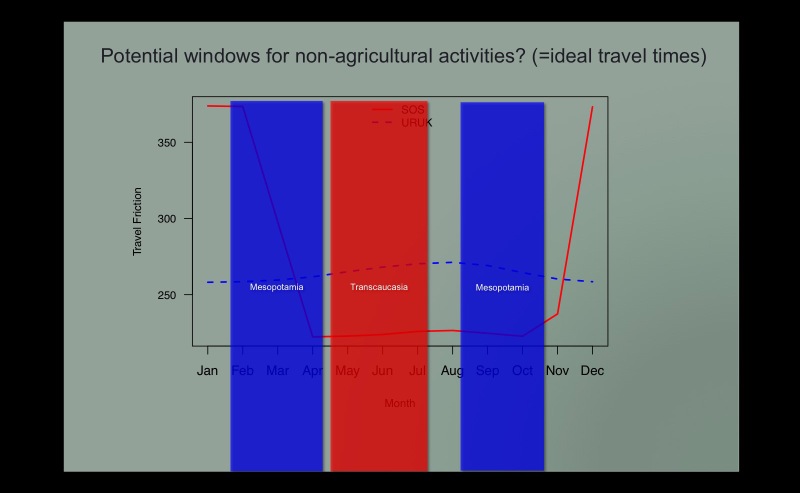
More generally we can also begin to characterize the relative seasonality of single sites and whole cultural zones. For example we can compare the village of Sos Höyük (a small settlement in the Pasinler plain in central Transcaucasia), with the city of Uruk (in the Sumerian plain).
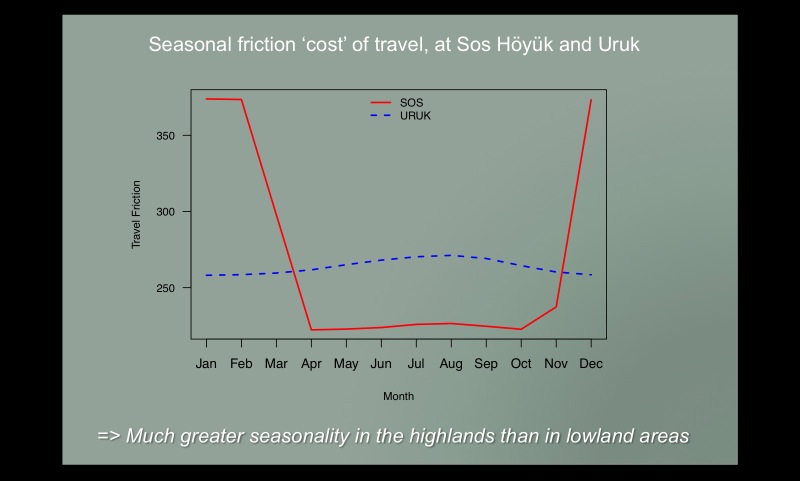
This graph shows a readout representing the relative seasonal friction cost at Sos Höyük and Uruk and starkly highlights the greater seasonality in travel opportunity according to our model. Whilst this shows only two sites, we can do something similar with many different sites of the same ‘culture’ to consider the total degree of variability.
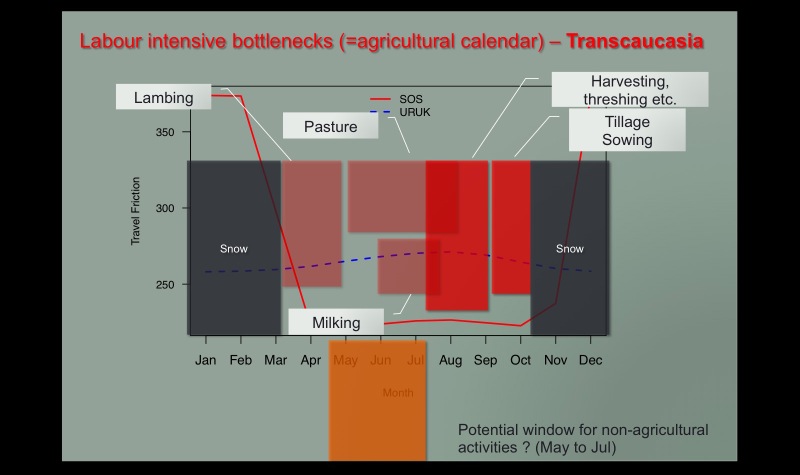
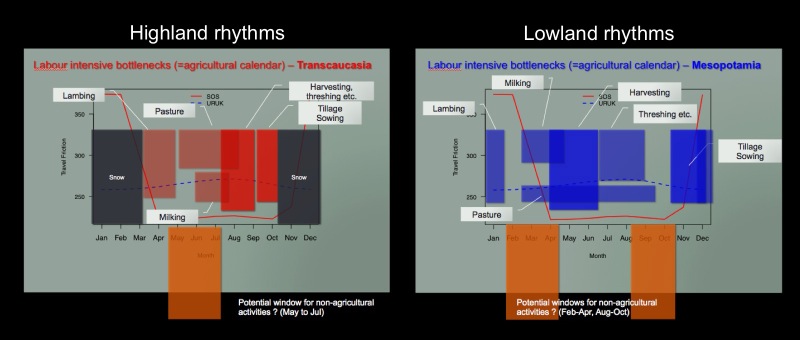
We can combine this information with knowledge about probable agricultural calendars, and the demands on labour, in order to suggest optimal trade times. This graph overlays a tentative agricultural timetable for the landscape around Sos Höyük in the Transcaucasian highlands (given the dependence on winter bread wheat and mixed farming strategies) which created a series of labour bottlenecks that restrict other activities, including non-agricultural trade and exchange.
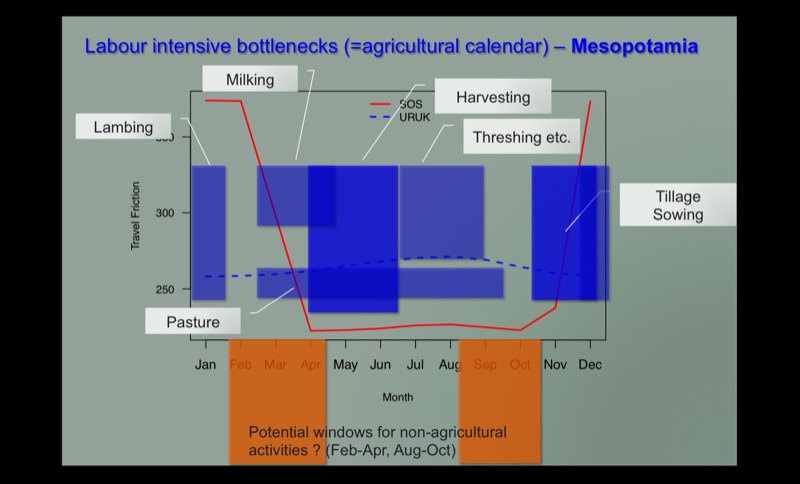
The equivalent diagram for Uruk in Mesopotamia shows a somewhat different set of time and labour related bottlenecks for travel and trade.
Comparing these windows starkly illustrates the regional differences: both in terms of:
- the potential time that can be devoted to non-pastoral travel (surplus time)
- the potential distance for interactions (the ‘tyranny of distance’ or distance-parity)
- the fact that the two regimes are pretty much incompatible in terms of labour rhythms, which (long-term) would restrict the form and types of interaction between these example locations.
This is important because it highlights one of the many (possible) reasons for highland–lowland cultural disparities: it is not just about raw topography but about different and even incompatible cultural rhythms.
Concluding comments
Various improvements to the basic model and methodology could be suggested. The most useful applications will be ones where one can play with the model to compare the consequences of different situations (e.g. the changing degree of snow cover in different climatic systems, or when the seasonal access to different material sources as they come to be recognized).
- Inclusion of water availability
- Fine tuning of relative factors
- Experimental data which might allow us to check whether our ‘model’ of seasonal travel has any validity (e.g. exactly how much does snow restrict movement compared to topography)
- More data on seasonal labour bottlenecks?
- Transport technology variation?
- Labour hierarchies and surplus?
Additionally, not addressed here, is the ways in which particular technologies (pack animals, infrastructure such as inns and caravansaray) may have been used to overcome the geographical and seasonal constraints imposed. These, of course, also have aspects of seasonality: pack animals have optimal times to travel and I would be interested to find out whether this is something we could model visually and consider the consequences of the donkey and wheel for rhythms of interdependence.
Nonetheless, to my mind these preliminary results suggest a set of methodological techniques which might move us beyond zonal characterization of highland and lowlands, to assessments of potential movement and interaction at both macro- and micro- scales.
Acknowledgements
Thanks to Paul Halstead and Catherine Longford for their suggestions on agricultural timetables, particularly in the Caucasus, and to the Donkey Sanctuary and Jill Goulder on donkey welfare and relationship to heat. Errors and misinterpretations remain the responsibility of the author. Thanks also to Dave Wengrow and to Claudia Glatz and Aphroditi Sorotou for the opportunity to present slightly different versions of these ideas at workshops within the BANEA and SAA annual conferences respectively in early 2015. Thanks also to Simone Bonzano for his subsequent enthusiasm and ongoing discussion about the idea of wedding seasonality to friction/cost models.
Part of the research for this paper was supported through a TÜBITAK postdoctoral fellowship (BIDEB-2216) based at Istanbul University, Turkey.
Websites
- Threads of Eurasia Project maps/figures/models/appendices: http://tobywilkinson.co.uk/threadsofeurasia/
- WorldClim database: http://www.worldclim.org/paleo-climate