 Occasional Papers (2009-)
 Site Visualisations
| Introduction to Remote Sensing data for Global Archaeology
Toby Wilkinson, University of Sheffield |
|
This document briefly introduces some of the key sources of spatial data from remote sensing sources, and a few other data types which have been particularly useful for archaeological research, and in particular, in the construction of ArchAtlas.
Archaeological Applications
1. Contextual mapping
Basic contextual mapping has been and will undoubtedly continue to provide the dominant usage for satellite imagery in the near-future as those archaeologists undertaking landscape surveys and regional analyses realise the ease with which satellite imagery may be used as attractive and informative 'backdrop' to distribution maps. In particular the ability to overlay previously blank white or simple vector distribution maps over textured satellite imagery could have considerable benefit for publishing and understanding of archaeological landscapes. Almost all the types mentioned in this tutorial may be used productively in this fashion, either as navigation aids in the field, or as a way to understand the context of a site in its landscape on a larger scale.
Possible datasets to use: BlueMarble, LANDSAT, Quickbird/IKONOS, SPOT, CORONA, SRTM, Astronaut's photographs, ASTER
2. Site prospection
Like aerial photography, satellite imagery may be used for visible site prospection, identification and later identification. In particular CORONA has been useful to reveal surface features in large areas of landscape from the 1960s and 70s. Other imagery might equally be of use here, though of course. With georeferenced imagery in particular, the ability to record co-ordinates and then 'ground-truth' them has become invaluable. The free availability of Quickbird through Google Earth has enabled a far-wider range of people access to high-resolution imagery. Mobile internet may also allow these images to be used in the field, in future. ArchAtlas includes a number of examples of this sort of productive use of satellite imagery/remote sensing: eg. Mühl (2007), Philip (2007), Ur (2007), T.J. Wilkinson (2007).
Possible datasets to use: CORONA, Quickbird/IKONOS, SPOT, ASTER, LANDSAT, SRTM
3. Semi-automated site-prospection (and categorization)
The digital nature of modern satellite imagery also means that computers can be used to aid in the above process of site prospecting. While a computer can not yet replace the human interpretation combined with ground-truthing, automated processing of reflectance and topographical data can be used to significantly cut down the options, so allowing the human investigator to intervene selectively. This will undoubtedly be a growth area for archaeological remote sensing in the future, but the main problem with this kind of work is the greater technical and/or programming expertise required to perform the tasks. Few people are trained sufficiently to be able to do this easily, and guidance on the web is still in its infancy. Even where programming may not be necessary (where tools are available to process data), the cost of software can often be prohibitive. ArchAtlas has published two related examples of this kind of application, one using SRTM to identify tells (Menze 2004), and the other developing this further to allow classification from ASTER data (Menze 2007).
Possible datasets to use: ASTER, SRTM, Quickbird/IKONOS, SPOT, LANDSAT
4. Landscape modelling and environmental reconstruction
Another growth area in archaeological applications of satellite imagery will be in the modelling of landscapes and past environments. Satellite imagery has already been used, for example, to reconstruct ancient water channels (both natural and man-made), as a means to accessing past environments (see for example Hritz & Wilkinson 2006, Mühl 2007). Beyond this, topographical data from DEMs may be used to predict trade routes, for example, and the range of environmental data from datasets such as ASTER may allow much speedier classification of environments in the present (hydrology, vegetational zones etc), or provide indications of past environments. On a qualitative level, detailed satellite imagery also provides basic environmental background to sites, allowing better understanding of their position and significance (see for example, Sherratt (2004) on Environmental Change).
Possible datasets to use: ASTER, SRTM, CORONA, LANDSAT, Quickbird/IKONOS, SPOT
The datasets: types of satellite imagery
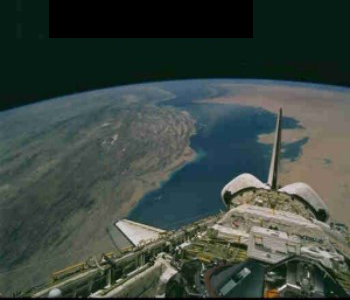
Astronauts' photography
View over Lake Van, Eastern Turkey, courtesy of NASA - ESC_large_ISS015_ISS015-E-18947
Photographs taken by astronauts on the NASA Space Shuttles and International Space Stations are a rich, if now sometimes overlooked, source of imagery of the Earth from above. Most of the images are not georeferenced or orthorectified in any sense, beyond the fact that they are linked to particular locations by their metadata. While this restricts their immediate use in GIS systems, they have wide applicability in the understanding of topography, landscape and human and natural actions, and in their general visual analysis. Photographs have often been taken at significant moments/events, or of significant features, and thus provide a wealth of interesting data. Usually, they may also be reproduced for free, as long as they are correctly attributed to NASA.
| Source | NASA |
| Cost | Free to download |
| Resolution | Various |
| Tile footprint (swath) | Various |
| Tile data size | Various (c. 1-10Mb) |
| Spectrum | Normal photographic/visible (Red, Green, Blue) |
| Georeferencing | Not normally georeferenced or orthorectified |
| Coverage | Various (global but not systematic); use NASA's search site above for coverage |
| Dates | Various (ongoing) |
| Reproduction Rights | Free to use, with correct NASA attribution |
Quickbird and IKONOS
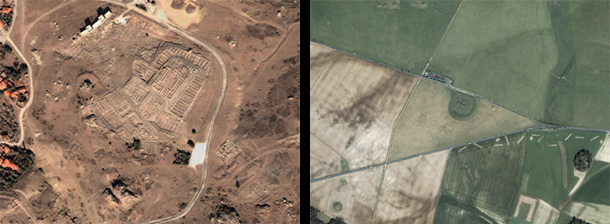
Left: Quickbird. Right: GeoEye (© GeoEye 2008)
Quickbird and IKONOS (and IKONOS' successor GeoEye1) are very similar types of satellite imagery based on commercial photographic satellites. These images are very similar to vertical aerial photographs, which are used to produce much of the highest resolution imagery on Google Earth. Of the two, Quickbird is the most commonly used in archaeology. Normally the imagery can be delivered fully georeferenced and orthorectified, and this allows fairly easy integration into existing GIS software. This has also allowed the imagery to be used as the basis for georeferencing other types of imagery (eg. Beck et al. 2007). Quickbird images are photographed in tiles, and conveniently Google Earth has a layer which shows the distribution of the footprint of these tiles, including the date and time of photography, and a link to a preview which allows you to view the cloud cover etc. There are a range of options to be decided when purchasing the imagery. For archaeological purposes, it is recommended that panchromatic data is selected. An additional layer in the Quickbird data allows increased sharpening of imagery (including other images) - often extremely useful for delineating archaeological features. The major downside of Quickbird imagery is the price - unless working in a fairly small area, or with particular research objects which require the resolution and detailed photographic texture, the cost is prohibitive. Instead, the available imagery in Google Earth may often be all that is required for visual interpretation and exploration.
| Source | Quickbird: DigitalGlobe
IKONOS & GeoEye1: GeoEye |
| Cost | Expensive |
| Resolution | Quickbird: panchromatic (black & white) 60-70cm; multispectral 2.4 and 2.8m
IKONOS: panchromatic (1-m PAN) 0.8 m; multispectral (4-m MS) 4m; pan-sharpened (1-m PS) 1m GeoEye1: Panchromatic 0.41 m; multispectral 1.6m; pan-sharpened 0.5m |
| Tile footprint (swath) | Quickbird: c. 16.5 km by 16.5 km
IKONOS: c. 11 km by 11 km GeoEye1: c. 15.2 km by 15.2 km |
| Tile data size | Quickbird, IKONOS: c. 0.5Gb
GeoEye1: c. 1Gb |
| Spectrum | Quickbird: Panchromatic, Red, Blue, Green, Infra Red
IKONOS & GeoEye1: Visible (red, green, blue) |
| Georeferencing | Quickbird: Normally georeferenced, can be requested as orthorectified
IKONOS & GeoEye1: Can be requested as georeferenced and orthorectified |
| Coverage | Quickbird: Selected strips of world surface (use Google Earth to identify coverage)
IKONOS & GeoEye1: Selected strips of world surface(use GeoEyes website for coverage) |
| Dates | Quickbird: 2001 - ongoing
IKONOS: 1999 - ongoing GeoEye1: 2008 - ongoing |
| Reproduction Rights | Quickbird: Licence normally allows publication of resultant imagery, but not redistribution of data. Check details.
Educational licence available.
IKONOS & GeoEye1:Licence normally allows publication of resultant imagery, but not redistribution of data. Check details. |
| More Information | Quickbird: http://www.tuarc.trentu.ca/~aspweb/en/downloads.shtml
IKONOS & GeoEye1:http://www.geoeye.com/CorpSite/products/imagery-sources/Comparison.aspx |
Corona and Declassified satellite photography
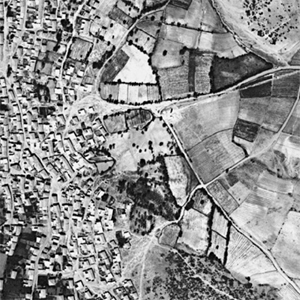
Declassified spy satellite data, particularly imagery from the CORONA satellite series, has proven particularly useful to archaeologists in many regions of the world. Its most extensive utilisation has been in the recording of features in the landscape of the Near East which have since been obliterated by the effects of intensive modern agriculture. Precisely because the imagery is dated (mostly between the 1960s and 70s), CORONA imagery thus provides the archaeologist with a temporal aspect to witness landscape transformations, and see things which have since been destroyed. The data is not normally georeferenced on delivery from USGS, requiring georeferencing. It is however, inexpensive to procure per square kilometre. For this reason, the CAMEL programme based at the Oriental Institute in Chicago has begun to collect and georeference CORONA imagery of the Middle East in its database and claim to be able to make this available for usage to archaeological researchers. The full coverage of the declassified imagery is not globally comprehensive, but rather reflects the interests of Cold War American military concerns. The actual ground resolution of scenes is variable for two reasons: first because of the different satellites and photographic equipment used on them, and secondly because of the distortion effects at the extremes of the images. Care should be taken to select 'high resolution' scenes wherever possible. Compared to modern colour imagery, CORONA is probably most effective in areas, which have undergone substantial change in the last 50 years, and also in regions of relatively flat terrain where archaeological features may be more easily discernible.
| Source | USGS |
| Cost | Inexpensive |
| Resolution | Various, may also vary within same image due to distortion |
| Tile footprint (swath) | Various, dependent on particular image |
| Tile data size | Tile data size Various, 40Mb to 1Gb per file (can be as much as 8Gb/image) |
| Spectrum | Declassified 1 black & white
Declassified 2 some colour, black & white |
| Georeferencing | Not normally georeferenced on delivery but see Beck et al. (2007) |
| Coverage | Tendency to cover areas of interest to US military during Cold War, including especially border regions of former USSR. Check USGS EarthExplorer website for coverage |
| Dates | Declassified Group 1 KH1-6, 1959 to 1972
Declassified Group 2 KH7&9, 1963 to 1980 |
| Reproduction Rights | Licence normally allows publication of resultant imagery, but not redistribution of data. Check details. |
| More Information | See Ur (2003)
Beck et al. (2007) http://www.archatlas.org/workshop/Ur07.php http://edc.usgs.gov/products/satellite/declass1.html http://edc.usgs.gov/products/satellite/declass2.html |
SPOT
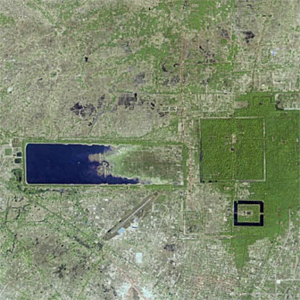
Angkor, SPOT 5, 2003
SPOT is a French-based series of satellites, which have a variety of sensors and purposes. The term 'SPOT' may be used for a variety of different types of imagery with quite different qualities, including SPOTView, SPOTMaps and SPOTDEM. Most archaeologists will be interested in 'SPOTView Ortho' which provides pre-processed imagery, georeferenced and orthorectified depending on specifications, suitable for direct import into a GIS or image-processing program. SPOT imagery usages are similar to Quickbird, IKONOS, or Corona. The imagery post-dates the world-wide expansion of intensive agriculture (mid-1980s), so gives a less historical picture than CORONA, but a slightly longer one than Quickbird or IKONOS.
| Source | SPOT Image |
| Cost | Expensive: see price list (http://www.spotimage.fr/web/en/336-price-lists.php) |
| Resolution | Various dependent on SPOT-x version:
SPOT 1,2,3 - Panchromatic 10m, Multispectral 20m SPOT 4,5 - 2.5m, 5m Panchromatic 10m |
| Tile footprint (swath) | 60 x 60km |
| Tile data size | DIMAP format (based on GeoTIFF) |
| Spectrum | Visible, Infrared |
| Georeferencing | Depends on particular product:
SPOTScene has limited adjustment, only Level 2A georectified but not tied to ground points SPOTView Ortho L2B & 3 geo-referenced and orthorectified SPOTMap fully ortho- & geo- rectified but covers limited area |
| Coverage | Check SpotImage website for coverage |
| Dates | Earliest 1986 onwards; SPOT 5, 2002- |
| Reproduction Rights | Check. |
| More Information | http://www.geoimage.com.au/geoweb/spot/spot_overview.htm |
SRTM terrain model
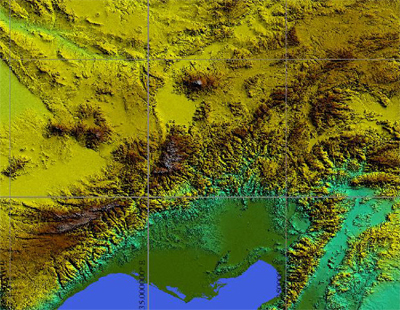
Cilicia, SRTM elevations as displayed by GlobalMapper
The Shuttle Radar Topography Mission (STRM) was a NASA programme designed to measure the elevation of the entire Earth's land surface based on a triangulation of bouncing radar signals sent from the Space Shuttle. Its immediate benefit has been a freely available, world wide Digital Elevation Model (DEM) which has applications in large scale mapping. It is used by both Google Earth and NASA's WorldWind, for example, to enable the 'three-dimensional' features of both programs. The full SRTM resolution is around 30m (only for North America) and 90m (rest of world). It is excellent for small regional terrain mapping, and with interpolation, can provide good visuals for local regions. In areas of particularly high relief, and a few 'watery' locations, the SRTM sensors could not get a reliable reading, and these areas appear blank on the NASA source data (SRTM2 & 3). SRTM data has a single spectral dimension, namely elevation and requires an appropriate GIS utility to view or convert. In archaeology, as well as providing a basis for three-dimensional modelling of landscapes for mapping of survey distributions, SRTM data has also been used in the identification of tell sites (both manually and semi-automatically), whose shape have a particularly recognisable signature in the wide flat plains of the Near East (see <a href='../Tellspotting/TellsMain.php'>Sherratt 2006</a>, Menze, Ur & Sherratt 2006).
| Source | NASA
CGIAR CSI (uses KML for Google Earth to aid selection) |
| Cost | Free to download |
| Resolution | North America 30m
Rest of World (downgraded to) 90m |
| Tile footprint (swath) | c. 110km N x 90km E |
| Tile data size | 0.2-1.9Mb compressed .hgt.zip format |
| Spectrum | DEM - Elevation only |
| Georeferencing | Georeferenced |
| Coverage | Global, but note some areas of high relief are blank in the basic downloaded data from NASA. In-filled or interpolated data is available from other suppliers. |
| Dates | 2000 |
| Reproduction Rights | Free to deploy, with appropriate attribution |
| More Information | See Sherratt (2006)
Hritz & Wilkinson (2006) |
ASTER wide-spectrum reflectivity
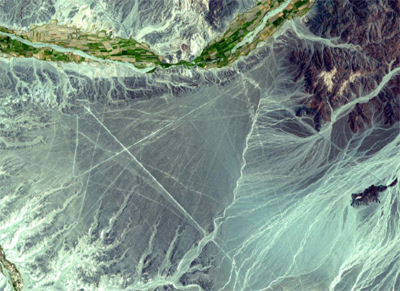
NASA ASTER image of Nazca lines in S. America
ASTER (Advanced Spaceborne Thermal Emission and Reflection Radiometer) is a sensor used to map land surface temperature, reflectance and elevation. With three different sensors onboard, covering 14 different bands, it has the advantage of offering considerable variables to assess the ground surface through temperature/reflectance, potentially modelling geology, hydrology and climate. For this reason it is particularly suitable to developing predictive modelling for site location, using more advanced image processing and filtering (see <a href='../workshop/Menze07.php'>Menze 2007</a>). The raw data also includes an additional visual band taken at a different angle, allowing a single tile of ASTER to form a stereoscopic pair, thus also enabling the creation of a Digital Elevation Model with suitable software. ASTER comes in several different versions, and it can often be difficult to work out exactly which is useful. Level 1A is a raw format, system corrected but receiving minimal processing. Level 1B is radiometrically and geometrically corrected based on orbit data, but not on ground control points. This means it is broadly geographically correct and can be imported into general GIS viewers for further processing or viewing, but there is often an offset accuracy error which needs correcting before the imagery can be used widely. The other 'levels' (2,3,4) are derived images designed to highlight surface reflectance.
| Source | NASA
http://edcimswww.cr.usgs.gov/pub/imswelcome/ http://www.gds.aster.ersdac.or.jp/gds_www2002/index_e.html http://asterweb.jpl.nasa.gov/NewReq.asp http://edcimswww.cr.usgs.gov/pub/imswelcome/ |
| Cost | Various. Inexpensive.
Some data can be obtained free (eg. Level 1A&B for USA) |
| Resolution | VNIR (visual) 15m
SWIR (infrared) 30m; TIR (thermal infrared) 90m |
| Tile footprint (swath) | 60km (horizontal) |
| Tile data size | Various |
| Spectrum | Visual, Shortwave Infrared, Thermal Infrared |
| Georeferencing | Level 1B has non-ground point based georeferencing and often requires minor correction (eg. with ENVI) , c. +/-20m |
| Coverage | Global |
| Dates | 1999 - |
| Reproduction Rights | Check |
| More Information | http://asterweb.jpl.nasa.gov/
http://www.archatlas.org/workshop/Menze07.php http://www.satimagingcorp.com/satellite-sensors/aster.html http://www.terrainmap.com/rm24.html#ASTERL1A |
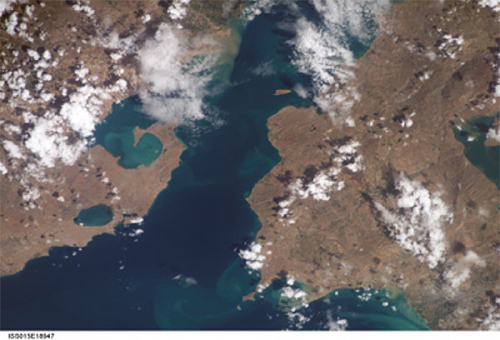
LANDSAT
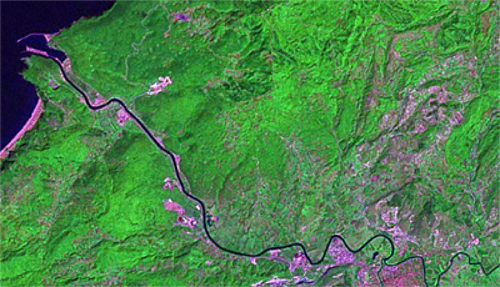
False colour LANDSAT 7 from north west Turkey
LANDSAT was one of the first forms of remote sensing data to be used extensively in archaeological mapping and landscape reconstruction. Unlike much of the photographic data which is from a particular point in time, LANDSAT is a synthetic mosaic of the Earth, taken over a long period of time to provide global coverage of the reflective quality of the land surface: it thus has zero cloud cover. LANDSAT 7 has 7 bands or spectral interest. The resultant images can be confusing as they are false colour composites (the colours produced are composites of the spectral data measured, but they are not the same as the 'photographic' spectrum). For this reason, 'natural' colour variants which have a more natural photographic appearance are widely available and in usage in a variety of contexts. The base Google Earth layers are 'TruEarth' based on LANDSAT 7, which has good spatial contrast on the regional level. LANDSAT 7's scale (15m) is good for pan-regional analysis as it easily shows the shape of the human intervention on the natural environment (roads, cities, agricultural field systems, natural environments, landscape zoning, water etc), but it is not detailed enough to be able to pick out individual archaeological features.
| Source | NASA / USGS / other commercial suppliers
https://zulu.ssc.nasa.gov/mrsid/ http://edcsns17.cr.usgs.gov/EarthExplorer/ http://www.resmap.com/ http://www.earthsat.com/HTML/naturalvue/ http://www.terracolor.net/ |
| Cost | Free to download. (More processed versions of LANDSAT such as simulated natural colour may cost to licence and reproduce). |
| Resolution | LANDSAT 1-3 multispectral 80m
LANDSAT 5 (TM) 30m LANDSAT 7 (ETM) 15m to 60m multispectral |
| Tile footprint (swath) | Varies depending on tile, but most c. 550km N x 700km E |
| Tile data size | LANDSAT 7 - 150-250Mb, compressed MrSID format |
| Spectrum | LANDSAT 7 - 7 spectral bands (most commonly viewed is '742')
'Natural' colour versions are available |
| Georeferencing | Georeferenced and orthorectified
(ArcMap requires the UTM spatial reference to be set) |
| Coverage | Global |
| Dates | LANDSAT 1-3: 1972-2002
LANDSAT 5: 1997 LANDSAT 7: 2002 |
| Reproduction Rights | Free to reproduce with NASA attribution. 'True'/'Natural' colour variants may cost to licence |
| More Information | http://landsat.gsfc.nasa.gov/
http://landsat.usgs.gov/index.php |
BlueMarble
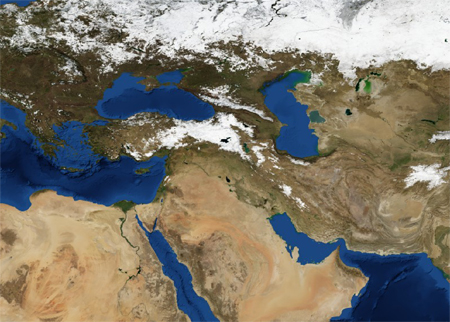
BlueMarble is a composite image (based on MODIS data from 2004) of the entire globe's surface. Though limited in its use for site prospection (the resolution of 500m is far too low for most purposes), it is an extremely clear and attractive basemap for explaining site context in a landscape, or regional relationships. It has been used extensively on <span class='logo'>ArchAtlas</span> for this purpose. The 'Next Generation' image set, which shows snow cover changes across the year, might also be used to think through ideas about seasonality and changing annual landscapes. BlueMarble is projected in a georeferenced way when downloaded, but ArcMap needs the projection metadata to be added before it can actually be recognised as such. This can be easily done manually with a tool like GlobalMapper, to provide the WGS84 latitude/longitude values for each corner (-180, 90, 180, -90), or slightly more complicatedly in ArcMap itself.
| Source | NASA: http://visibleearth.nasa.gov/view_set.php?categoryID=2355 |
| Cost | |
| Resolution | 500m, 2km, 8km |
| Tile footprint (swath) | Global (or divided into 8 segments) |
| Tile data size | eg. 24Mb per tile as JPEG |
| Spectrum | Visible |
| Georeferencing | Georeferenced, but may need to have spatial reference defined for use in ArcMap etc. |
| Coverage | Global |
| Dates | Composite of 2004; 12-monthly versions |
| Reproduction Rights | Free to reproduce with NASA attribution |
For further information:
- http://www.satimagingcorp.com/satellite-sensors.html for some accessible but detailed introductions to various global satellites
- http://www.terrainmap.com/ for guides to using satellite imagery and sources of free data.