 Occasional Papers (2009-)
 Site Visualisations
1. Introduction
(Copyright pictures: J.Ur.)
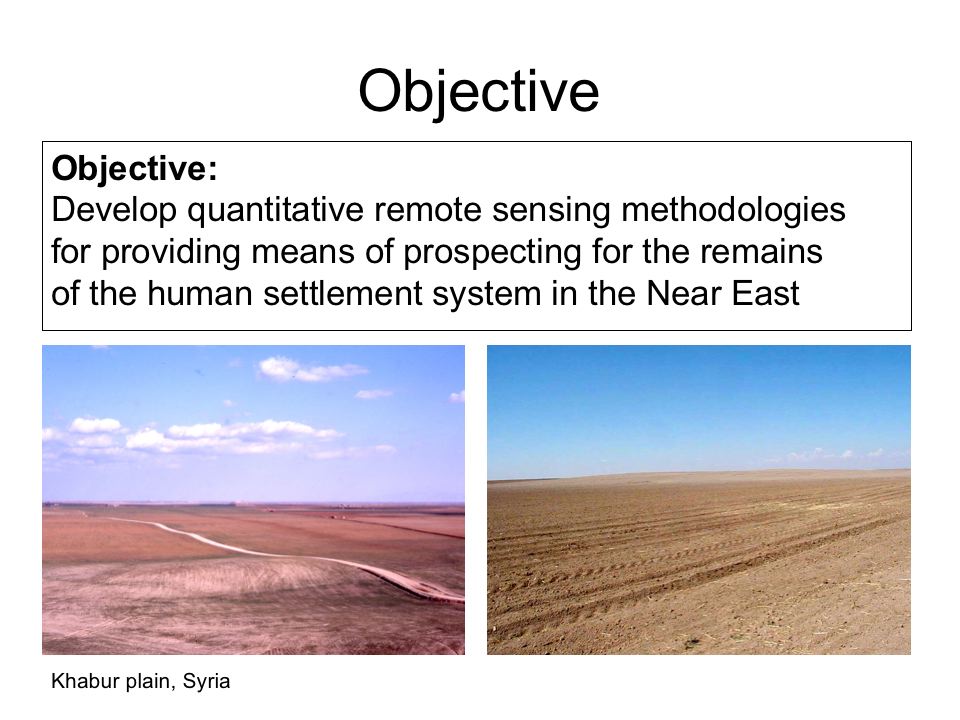
Few of the ancient settlement mounds are still inhabited – like Tell Arbil – while most remain abandoned as small artificial 'hills' in the landscapes of the near East. Many of them stand out from the fields, as clearly visible mounds, but an unestimated number of these former settlement sites can be identified by no more than characteristic anthropogenic changes of the soil (see image above). The aim of the presented work is to develop quantitative remote sensing methodologies for providing means of prospecting for these high- and low-mounded remains of the Near Eastern settlement system.
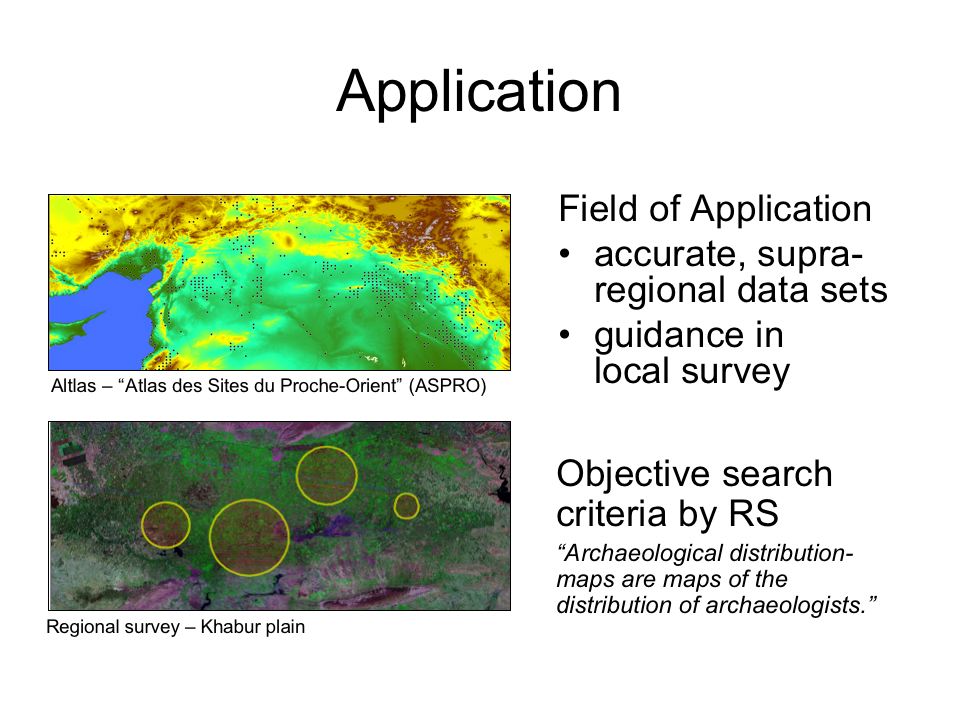
Such an automated analysis will allow for different fields of application. Wide areas of the Near East can be surveyed 'digitally' with limited effort. This allows us to compile supraregional data sets and to provide highly accurate spatial information for existing registers (like the ASPRO atlas, with sites localized on a 10km grid, see image above), ideally complementing them with so far unrecorded sites. Also, the analysis of satellite imagery can provide guidance in regional surveys (like surveys centered around Tell Beydar, Tell Brak, Tell Leilan or Tell Hamoukar in the upper Khabur basin, below in image above), when hundreds of square kilometers have to to be inspected on the ground within limited time. The possibility to evaluate remote sensing data systematically, according to objective criteria, is the main advantage of this approach.
1.1 Remote sensing of Tells
(Copyright picture of Tell Brak: J.Ur)
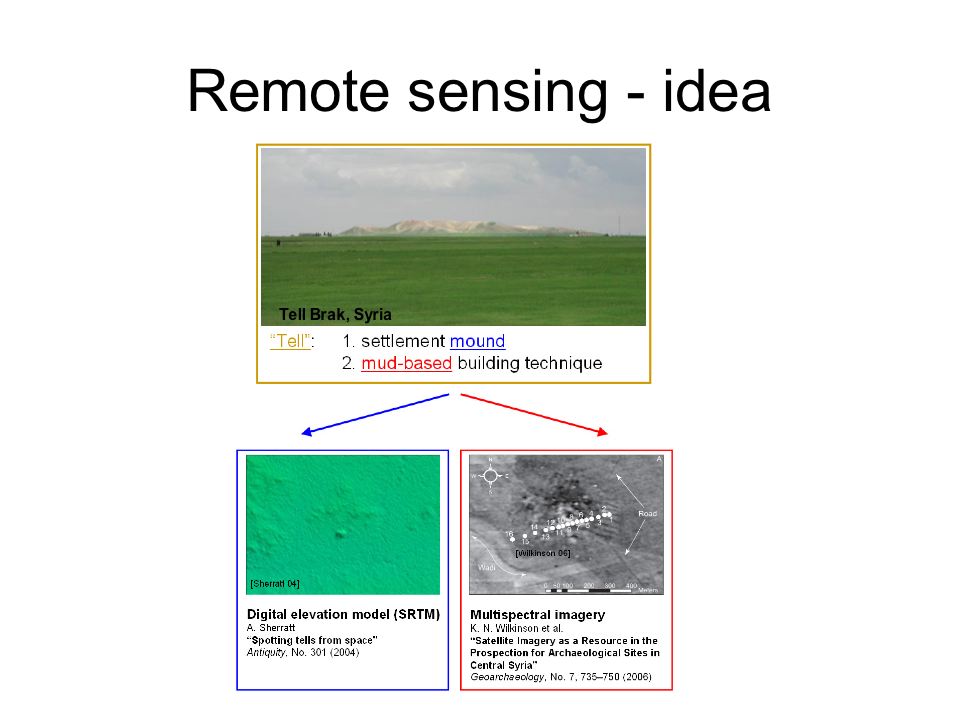
Resulting from the accumulation of settlement debris, there are two physical features which allow us to identify tells in data of spaceborne instruments:
With heights of up to 50m and diameters often between 100m and 500m, they are large enough to be spotted in digital elevation models. As A. Sherratt pointed out shortly after these data were released (Sherratt 2004), the elevation model of the Shuttle Radar Topography Mission (SRTM) with a relative vertical accuracy of 5m and a spatial resolution of 90m allows us to identify the positions of single mounds. Characteristic changes in the colour of the soil are another frequently reported feature of ancient settlement sites (Ur 2004). Sometimes they are clear enough to be seen in monochrome imagery (Ur 2004), but even more they provide a specific spectral pattern in multi-spectral satellite imagery (Wilkinson et al. 2006).
While both their physical extension and their spectral pattern can be used to identify ancient settlements in remotely sensed data, the advantage of an SRTM-based approach is in the supra-regional search for high-mounded sites. The advantage of multispectral imagery is in the search for both high- and low-mounded sites in a regional survey.
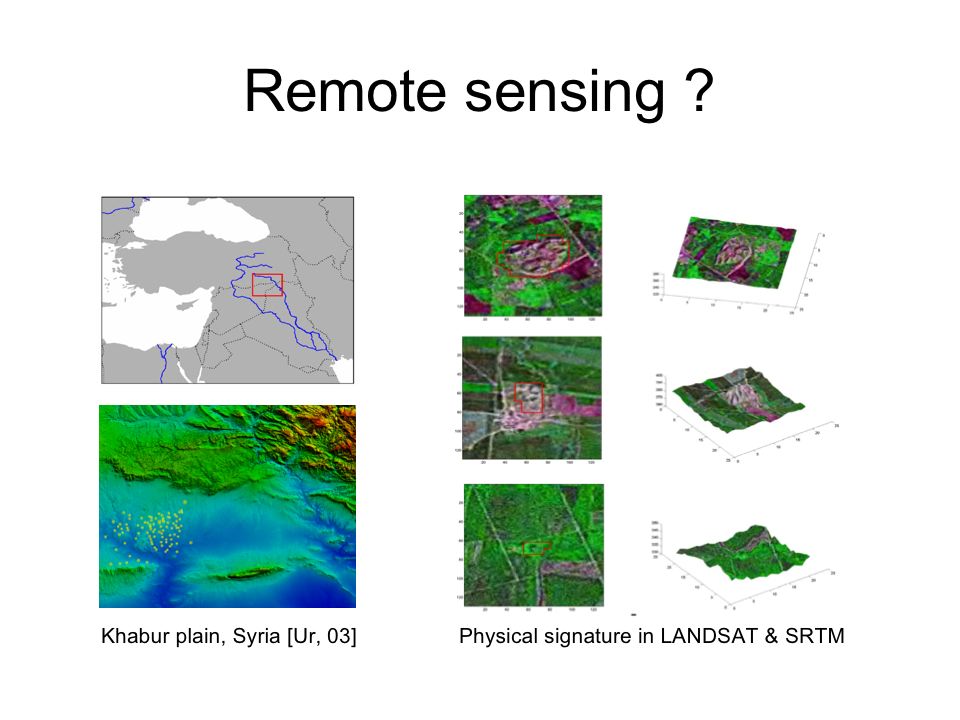
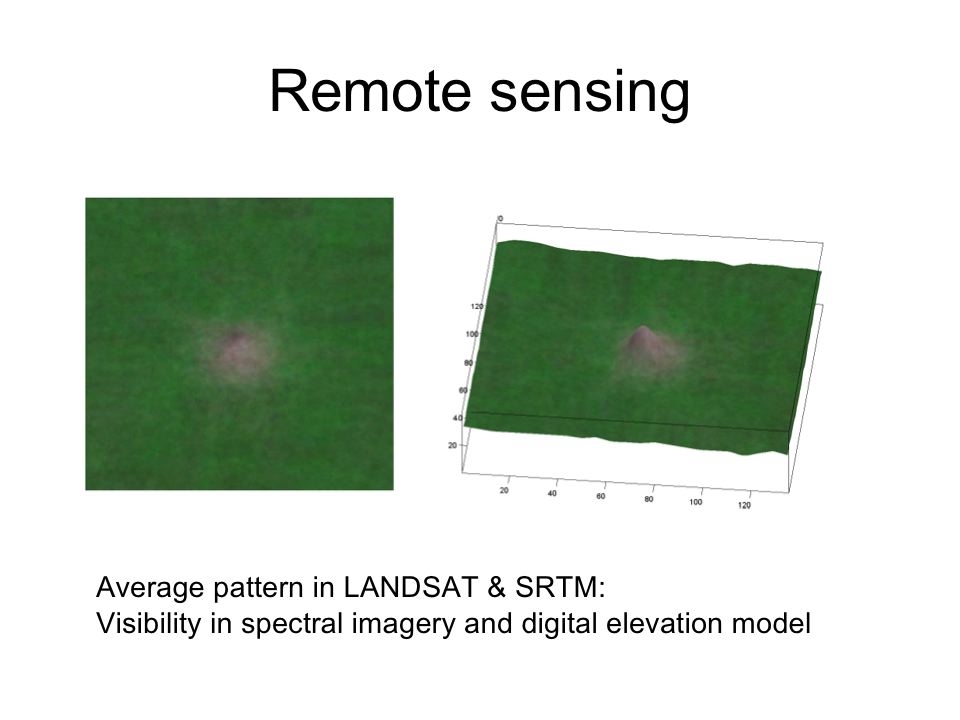
Machine based approaches in the search for both of these features will be evaluated in the following, on sites in the upper Kabur basin. A first inspection of sites previously localized using CORONA imagery (see image above, right) shows that single tell sites might be visible in multispectral LANDSAT ETM+ and SRTM data. Averaging the spatial and the spectral pattern of several dozens of sites (see image below) shows a distinct pattern for a tell in comparison to the pattern of its surroundings both in spectral imagery and the elevation model.
In the following section (section 2) methods for an automated identification of the spatial pattern of a tell will be presented, together with an evaluation of these methods against ground truth. A classification of multispectral imagery will be pursued and evaluated in the final section 3.
2. Digital elevation model – SRTM
2.1 Data
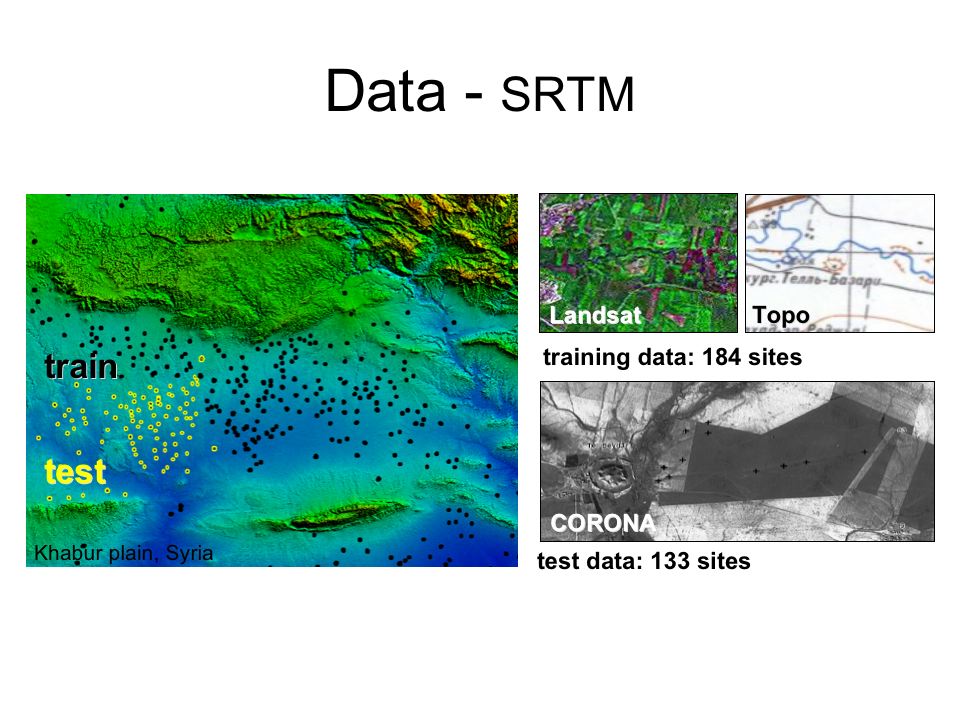
Two different data sets have been used in the design of a SRTM-based search for tells. The positions of the 184 sites in the first data set were identified by visual inspection of the SRTM tiles of the Khabur basin. These tell sites were confirmed using topographic maps and LANDSAT imagery and subsequently used for the design and the training of the classification algorithm. A second set of 133 sites identified from CORONA imagery (Ur 2004) was used to evaluate the classifier and compare its performance against 'ground-truth'.
2.2 Design of the classifier
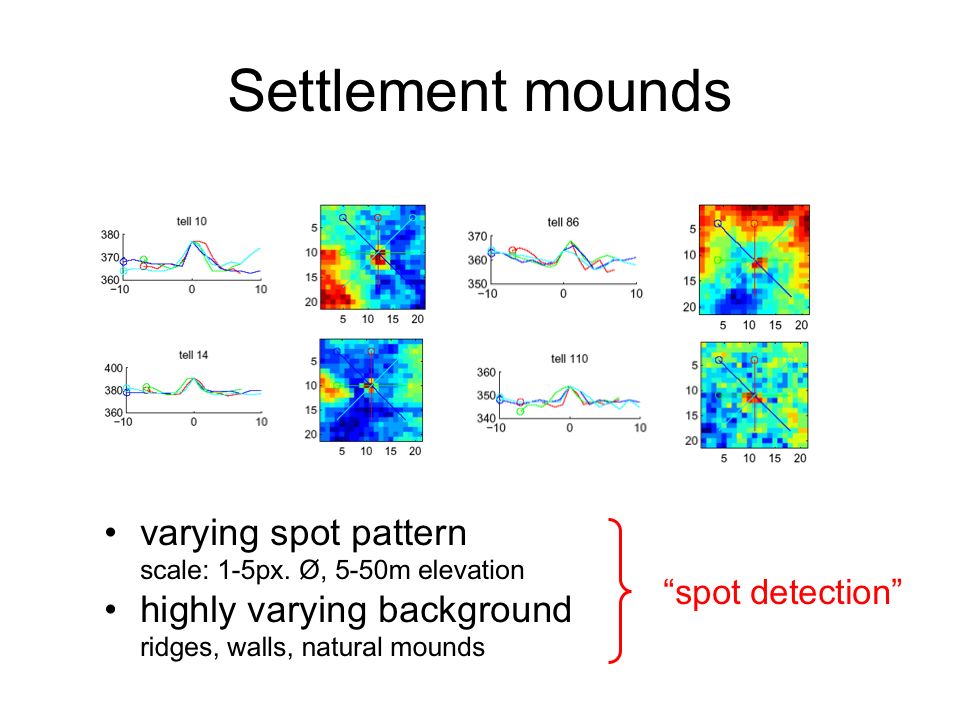
In the digital elevation model the small conical mound of a tell is represented by a characteristic point pattern, superposed onto the natural topography (image above, see DEM patches centered around tell and respective elevation profiles). The detection of tells is a point or spot detection problem.
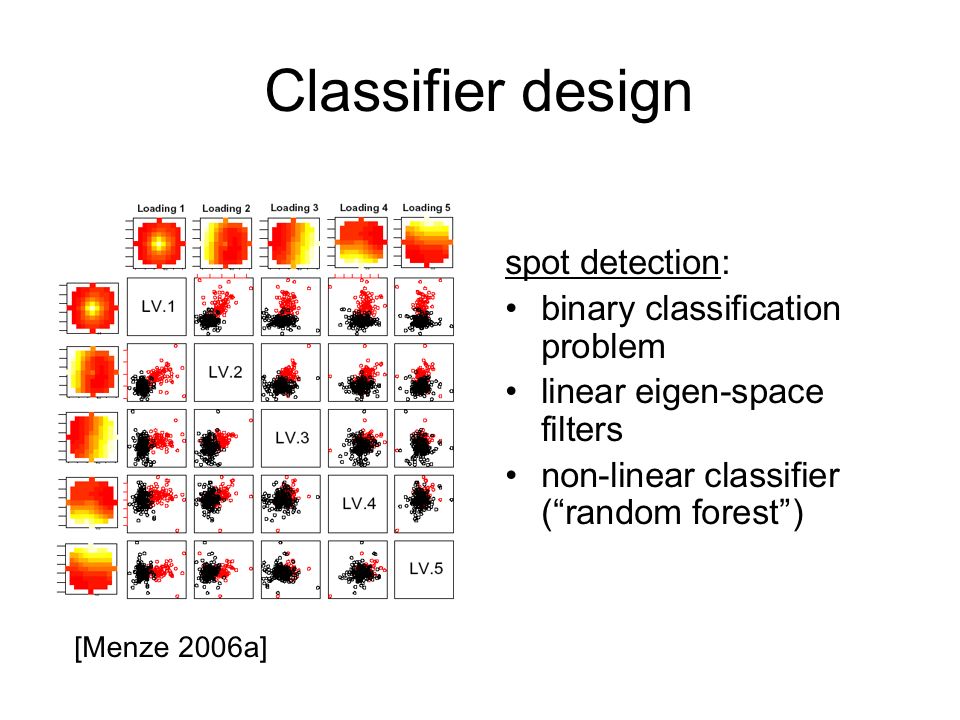
To identify a tell in the varying 'background' pattern of the natural topography, the detection problem was transformed into a binary classification task and a classifier was trained which was able to separate the pattern of a DEM patch centered around the point-like tell (see shape of the yellow-red filters in image above) from patterns of the background. To this end, a set of linear filters was learned in a first step, and a nonlinear classifier based on the scores of these filters in a second (Menze et al. 2006a).
2.2 Validation
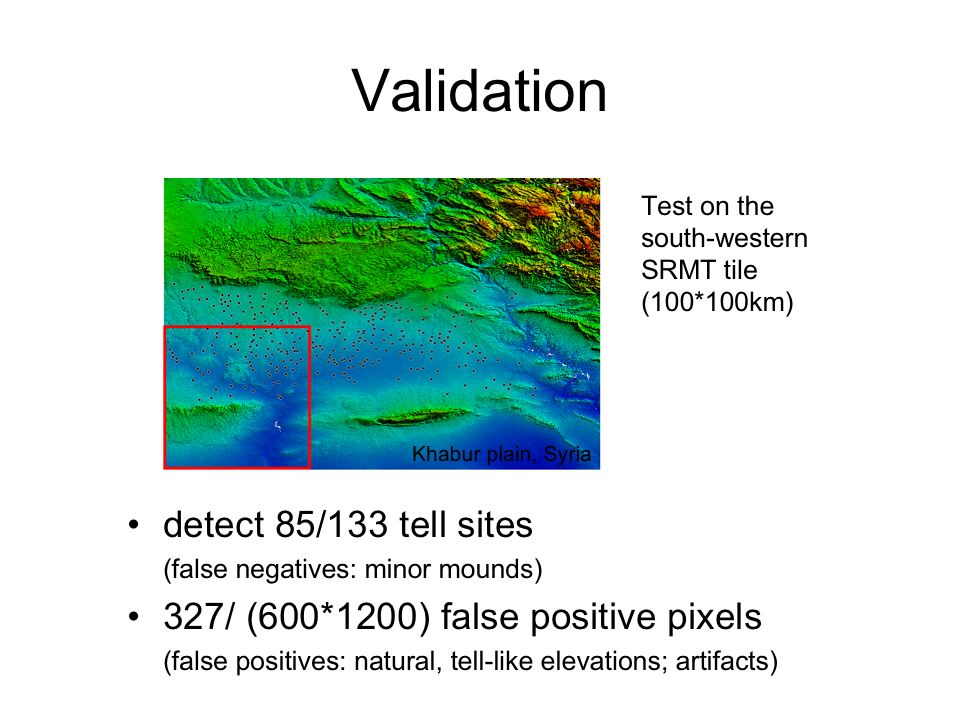
The classifier was applied to the SRTM tile covering the test region in the southwestern part of the Khabur basin. In this test, 85 out of the 133 test sites could be detected, at an acceptable number of false positives. False positives were mainly due to natural elevation resembling the elevation pattern of a tell, or due to artifacts. False negative sites were mainly mounds of minor size.
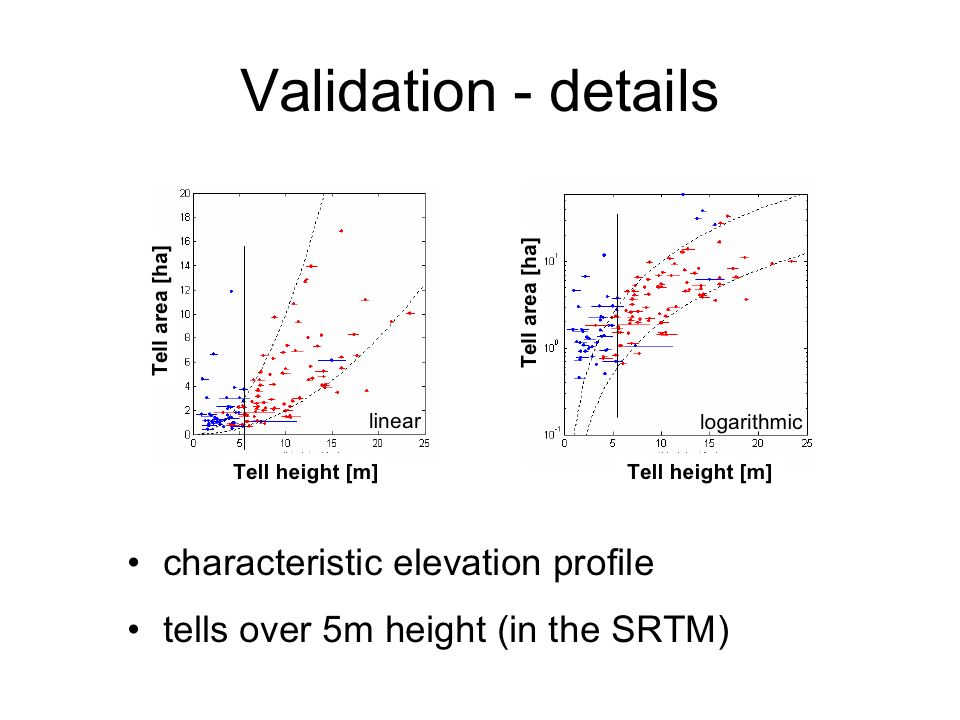
A more detailed analysis of detected (true positives, red in image above) and undetected (false negatives, blue in image above) sites showed that nearly all mounds with a height in the elevation model of more than 5-6m could be detected. Undetected sites were either below this limit, or did not show the characteristic shape of a tell, following the quadratic height-area-relation (outlined by dashed black lines in image above) which was observed for the majority of the tells (Menze et al. 2006b).
2.3 Application
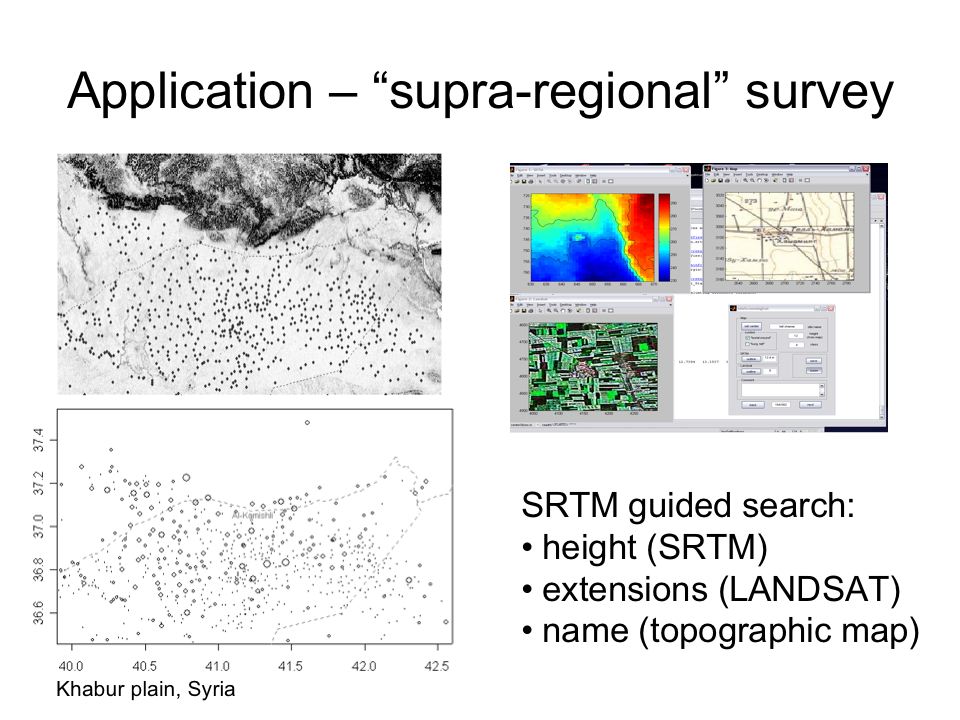
Finally, the classifier was applied in a 'supra-regional survey' to other areas of northern Mesopotamia. To discard false positive sites, a software tool was used to compare the position of sites detected in the SRTM with other sources of information such as topographic maps, or LANDSAT imagery (image above, right) and to record the height for any of these sites (image above, left).
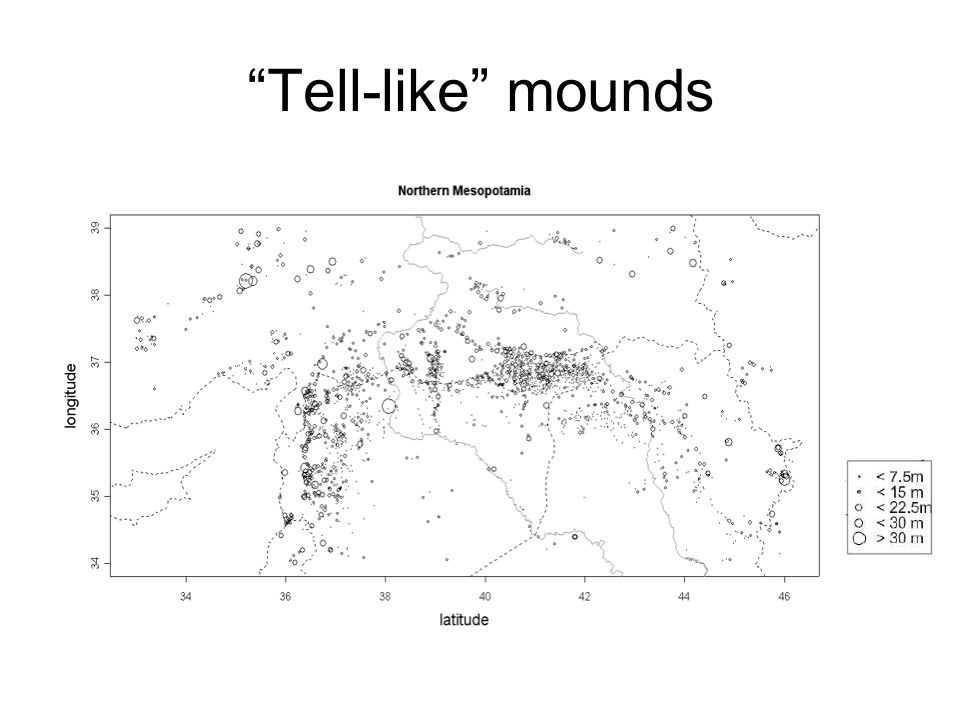
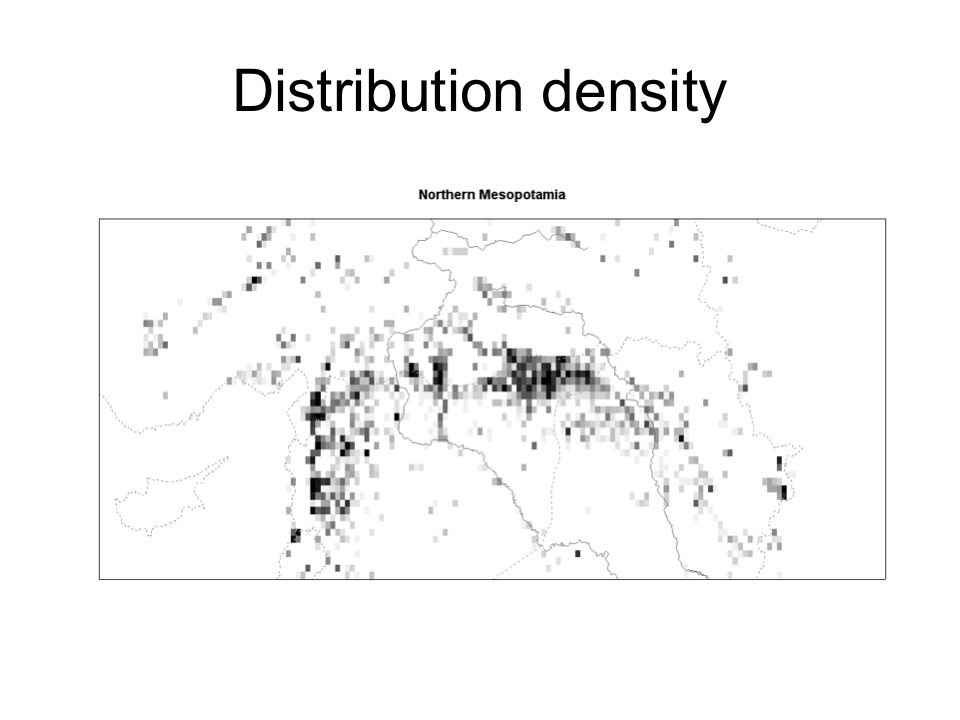
The sites visible in the SRTM clearly map the northern part of the fertile crescent with the most elevated mounds and the highest number of mounds at its outermost border.
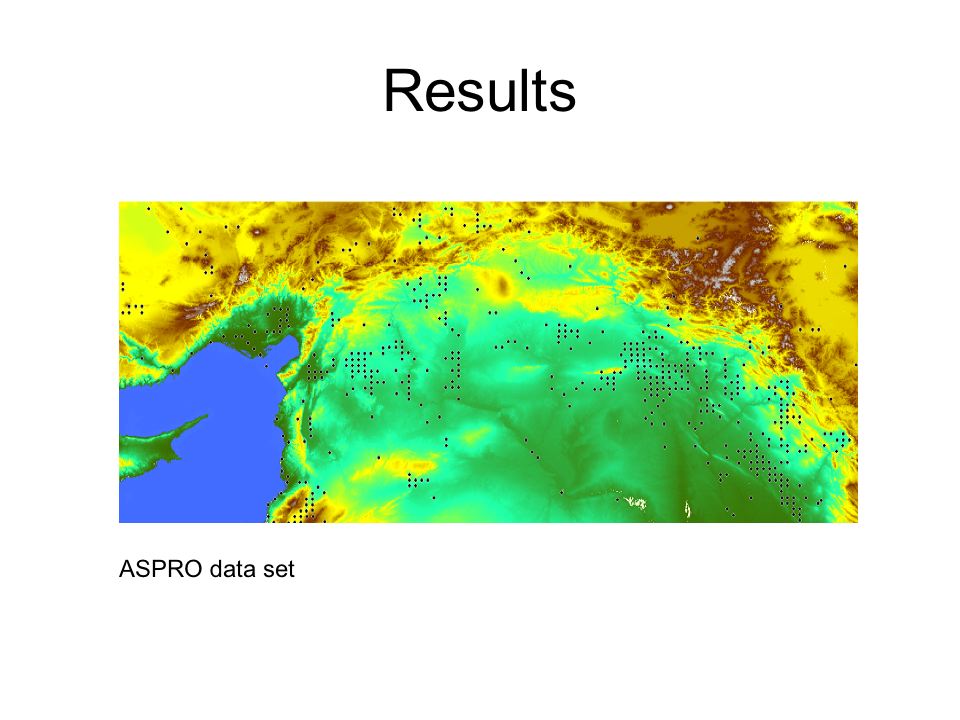
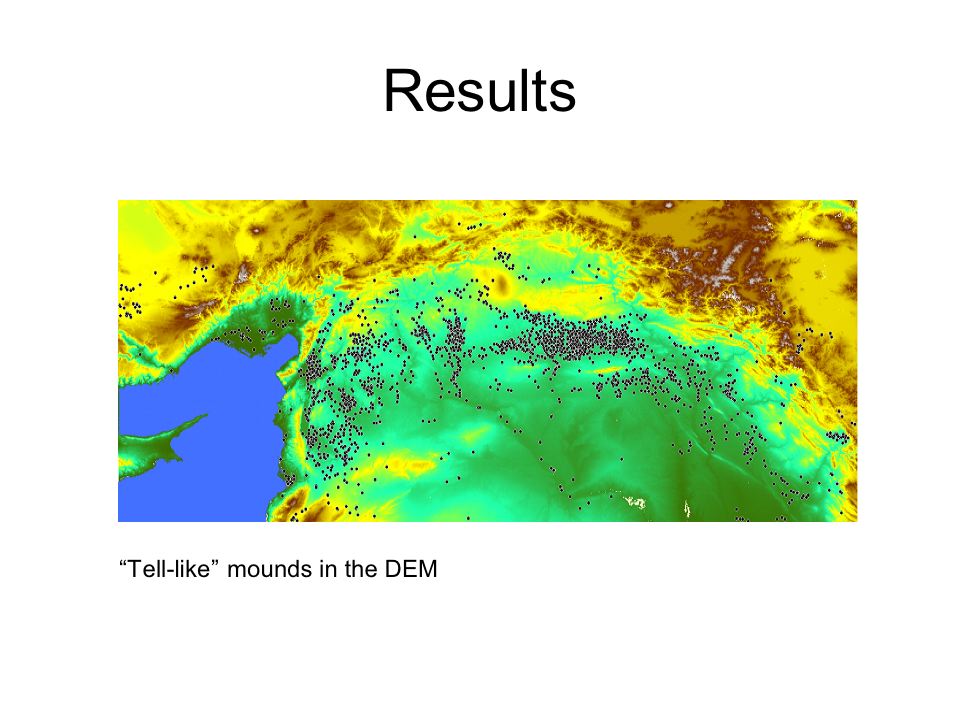
In comparison with, for example, sites registered in the ASPRO atlas (images above, top) the map of 'tell-like' mounds shows a highly comprehensive distribution of these sites in the digital elevation model (images above, bottom).
3. Spectral imagery – ASTER
3.1 Data
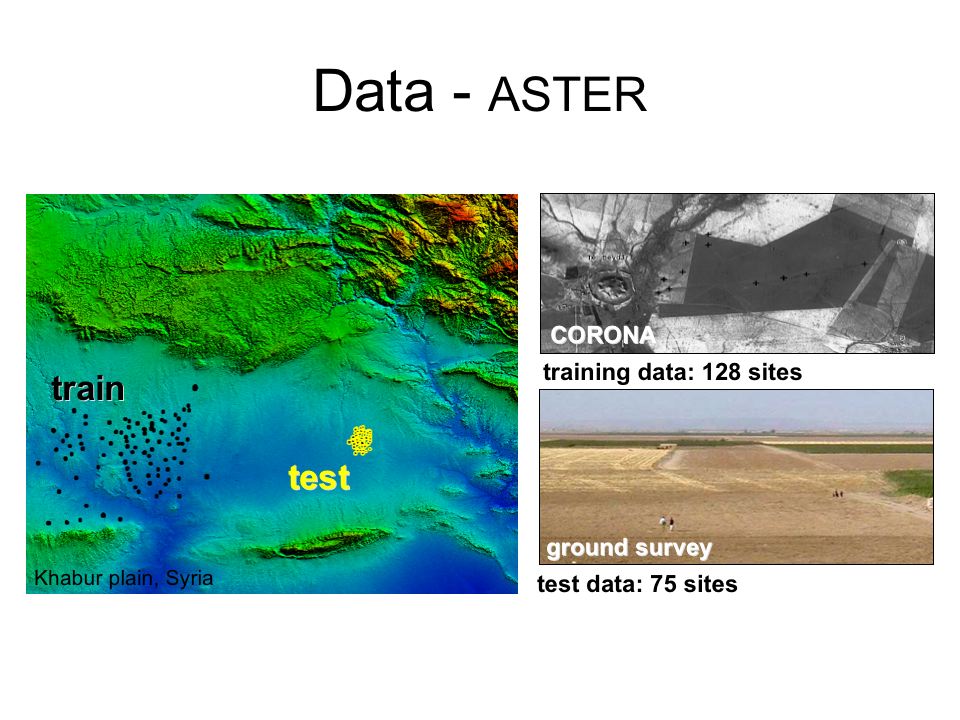
Two different data sets have been used in the search for former settlement sites in multispectral ASTER imagery (see image above). The training data comprised 133 sites identified in CORONA imagery (the same data as used for the validation of the SRTM algorithm). The test data were obtained from a ground survey around Tell Hamoukar, approx. 100km east of the training area (Ur 2002a & 2002b).
3.2 Design of the classifier
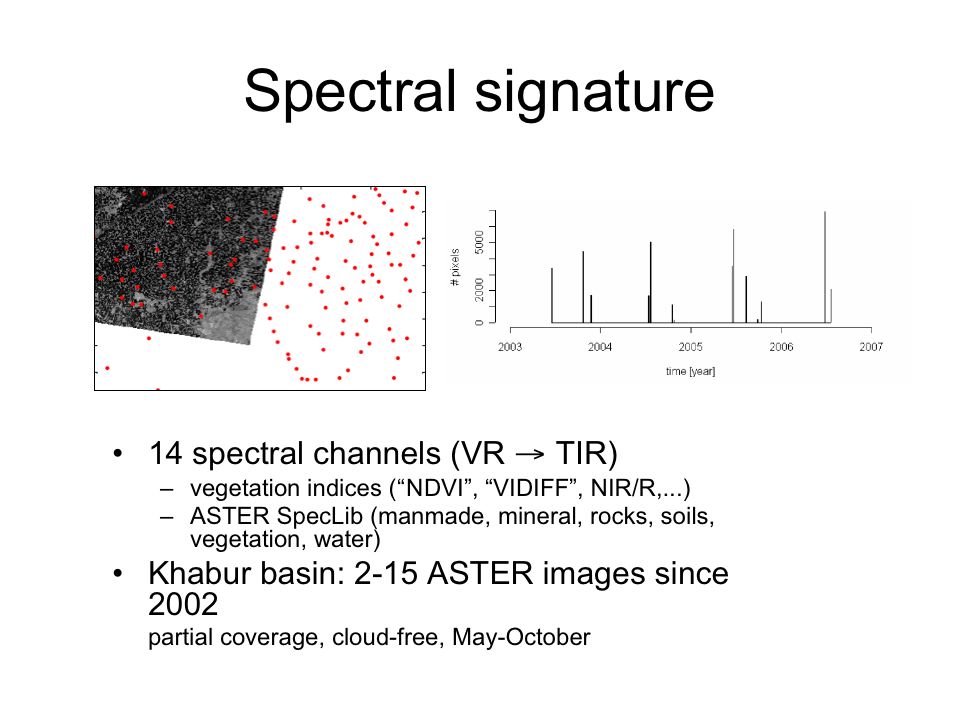
Different from the SRTM with its global coverage, ASTER scenes cover survey regions of a certain size only partially (image above, top left), but at different timepoints (image above, top right). In the training area of the Khabur region, 2-15 observations were available for each of the tells.
The ASTER sensor onboard the TERRA satellite provides imagery with 14 bands from the visible infrared to the thermal infrared, the spatial resolution ranges from 15-90m for the different bands. Different features like vegetation indices, or correlation with prototype spectra can be derived from these 14 bands and have been used as input to the classification (Menze & Ur forthcoming).
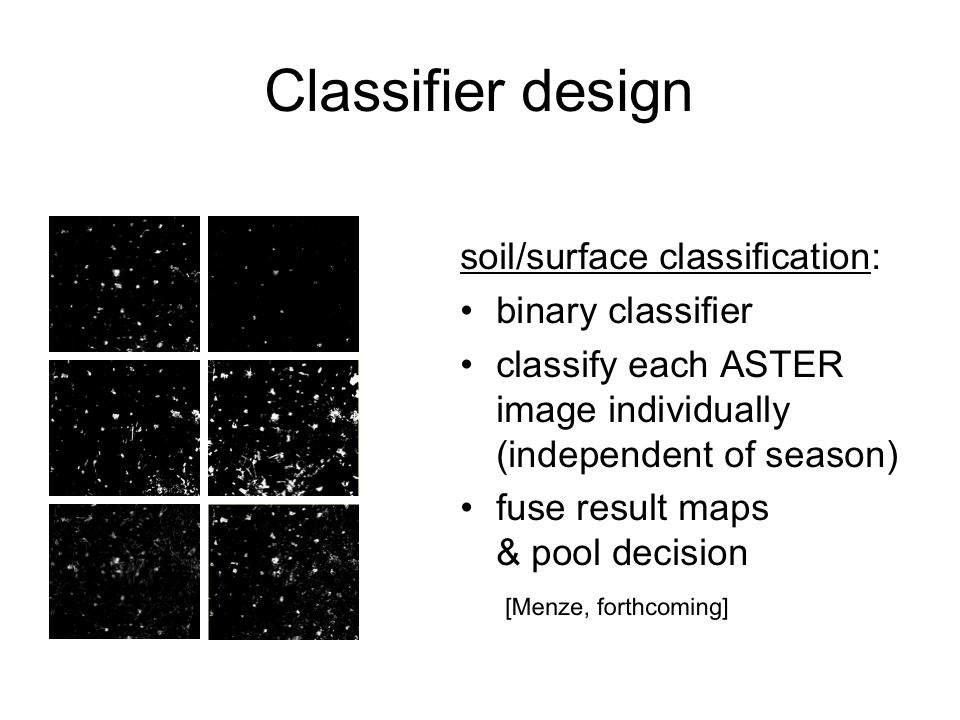
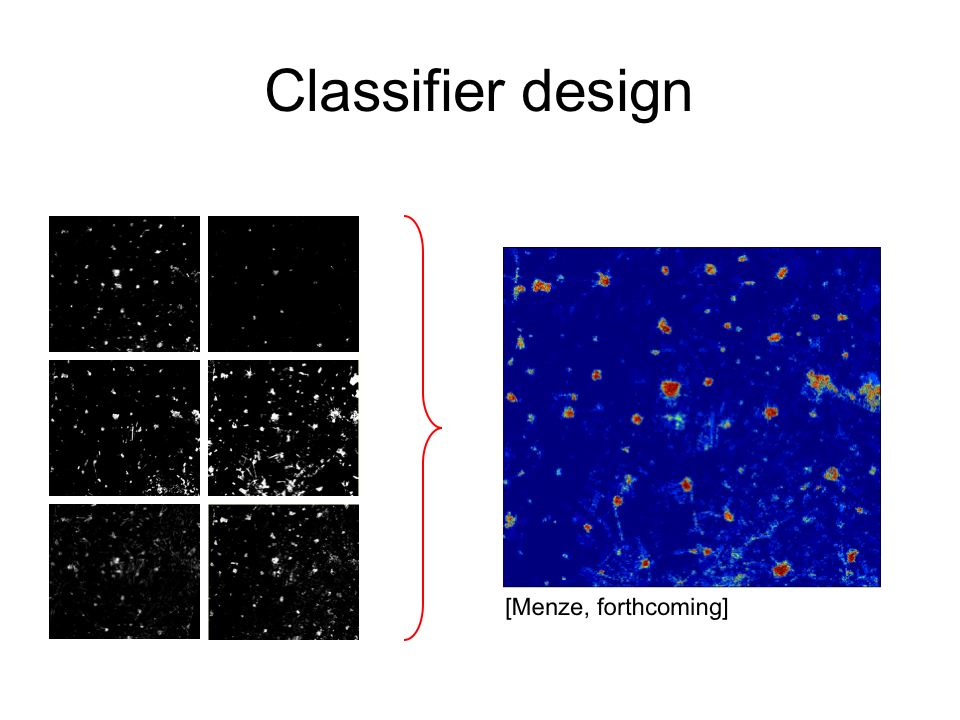
The idea of detecting the spectral signature of tells in ASTER scenes is to design a binary classifier to classify each image individually. A multi-temporal sampling strategy of the training data allows us to use one classifier for all different scenes (Menze & Ur forthcoming). Finally the results of all scenes available for a certain region are pooled.
3.3 Validation
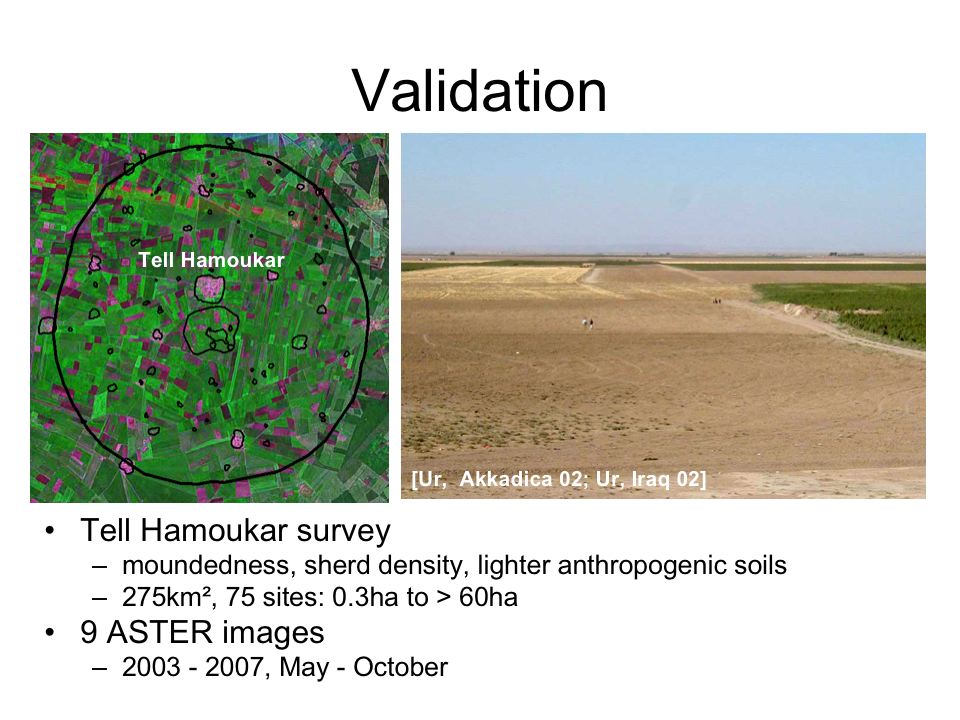
The classifier was applied to an area centered around Tell Hamoukar. In an area of approx. 275km2 size, a number of 75 settlement sites were confirmed in ground survey. Criteria were moundedness, a certain sherd density or the presence of lighter anthropogenic soils, out of which at least two had to be fulfilled at any of these sites (Ur 2002a & 2002b).
A total of nine ASTER scenes were available for this area, from the time of 2003-2007, none of them with overlap to the training region.
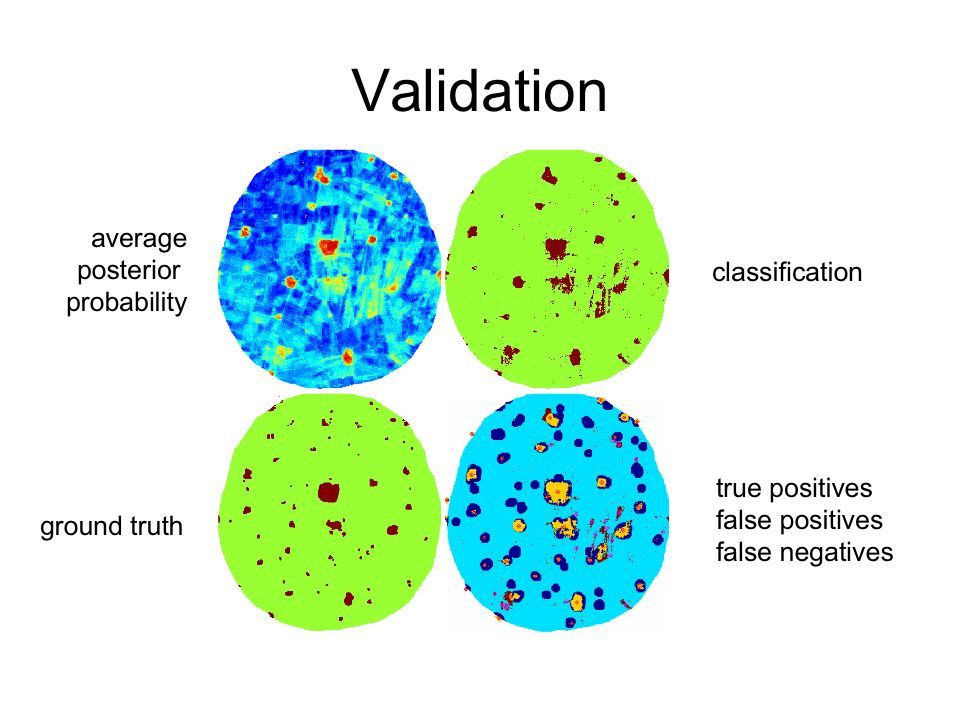
All scenes were classified and the resulting probability maps were averaged (image above, top left) and thresholded at 0.5 probability (image above, top right). Results were compared with the ground truth (image above, bottom left) and true/false positives and false negatives were assessed (image above, bottom right) (Menze & Ur forthcoming).
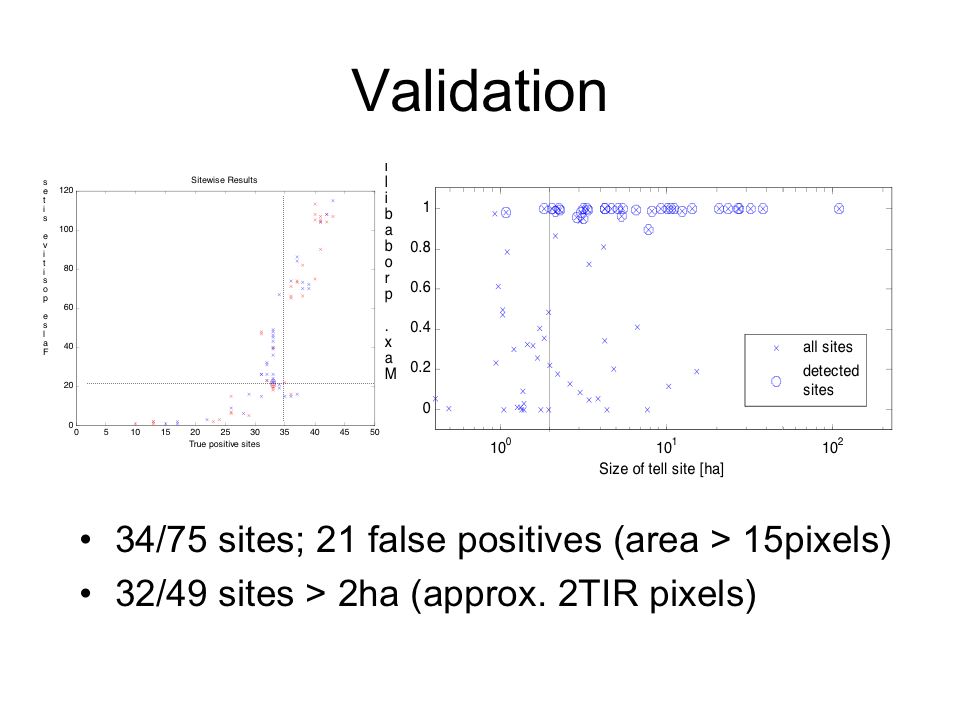
All connected areas with a size of more than 15 pixels (pixel size 15m*15m) were evaluated. In total 34 sites were identified, i.e. were true positives, at a number of 21 false positives. Out of the 49 sites which had a size of more than 2ha (equivalent to the size of 2 pixels in the thermal infrared band), 32 could be detected.
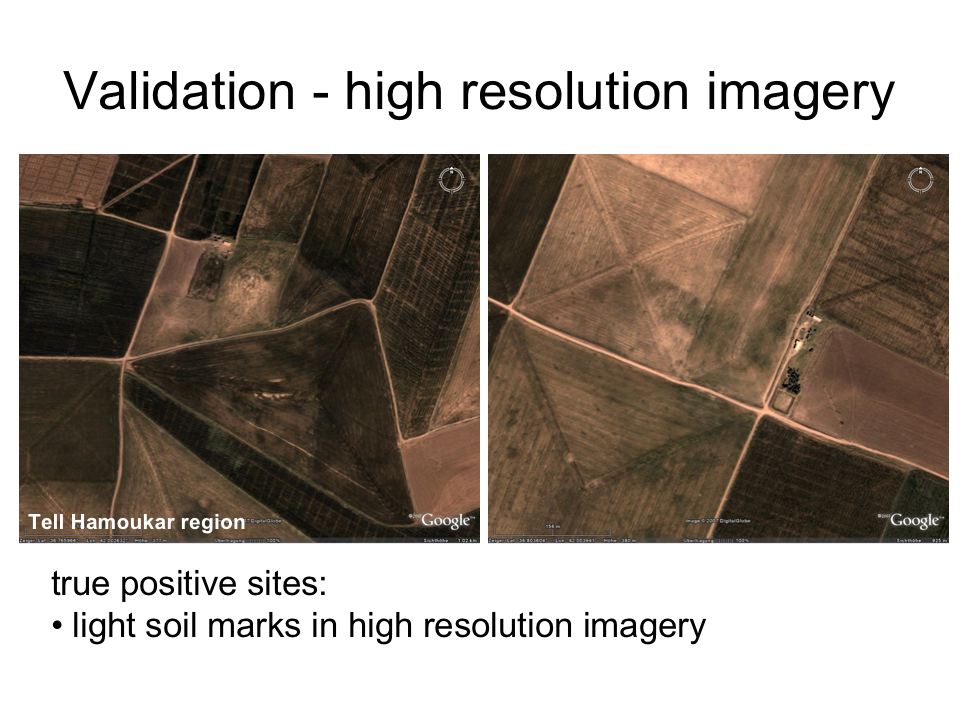
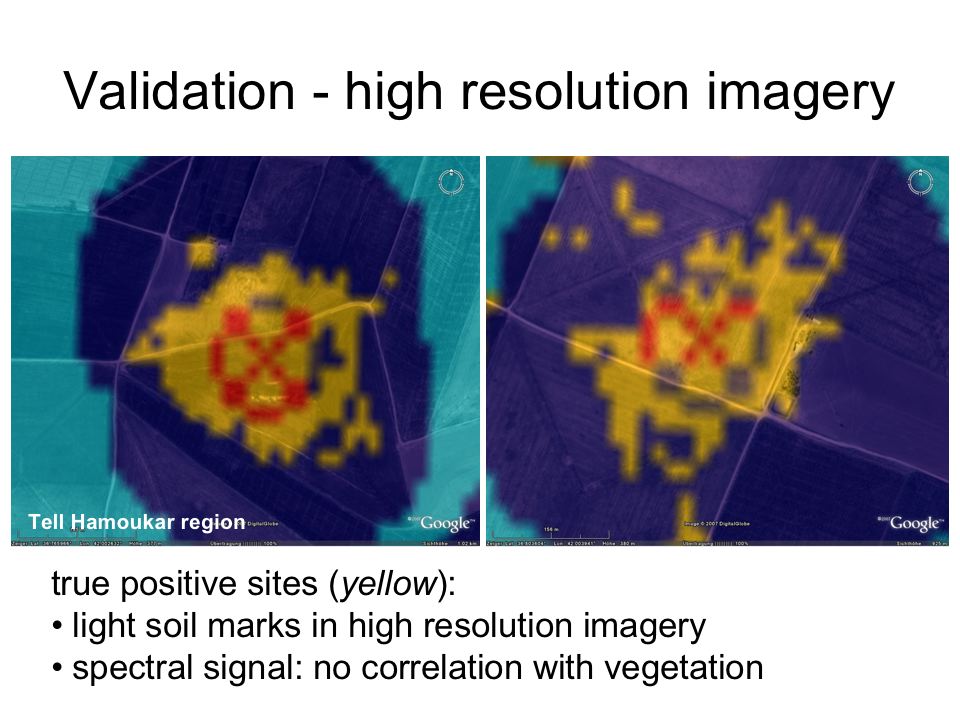
True positive sites were inspected in high resolution imagery (top image above). Light soil marks are visible and correlate well with the extensions of the ASTER classification (bottom image above, yellow), while no correlation with vegetation can be observed.
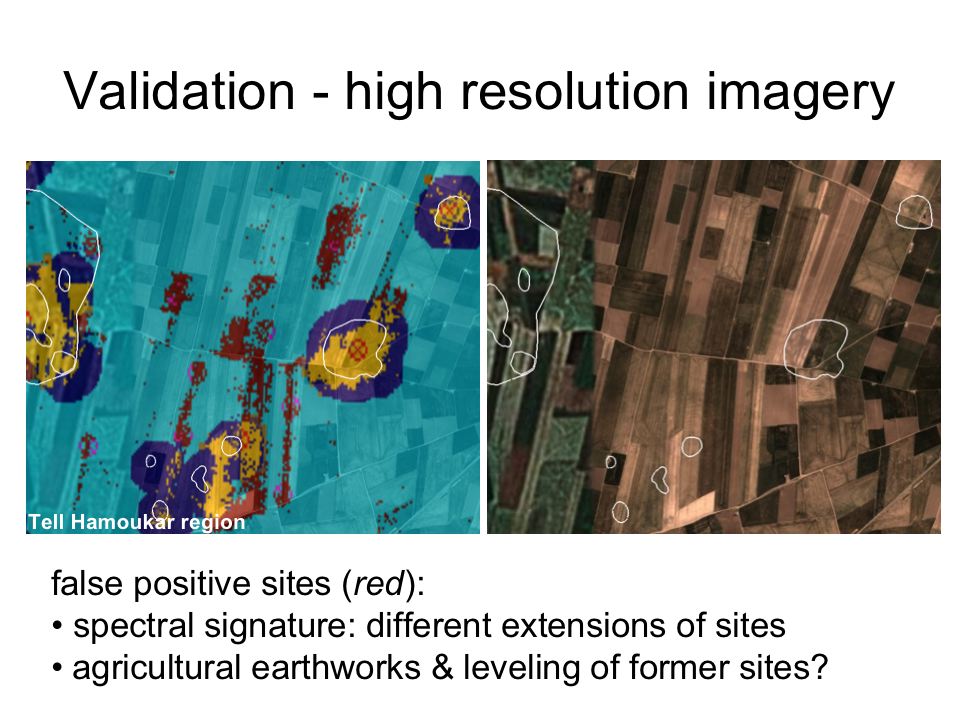
False negative sites (red colored pixels, image above) occurred when the extensions of a site in multispectral imagery did not match the extensions recorded on the ground (outlined white, image above). Also fields in the vicinity of confirmed sites showed tell-like soil patterns, possibly due to a leveling of former sites and a distribution of their soils.
3.3 Application
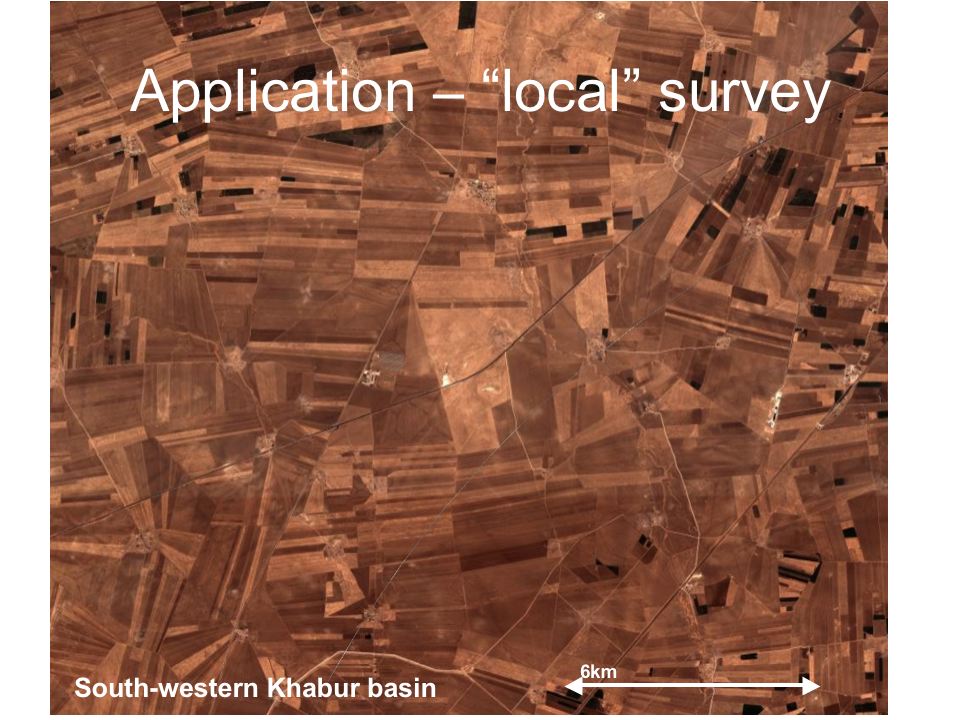
(Copyright: Google.)
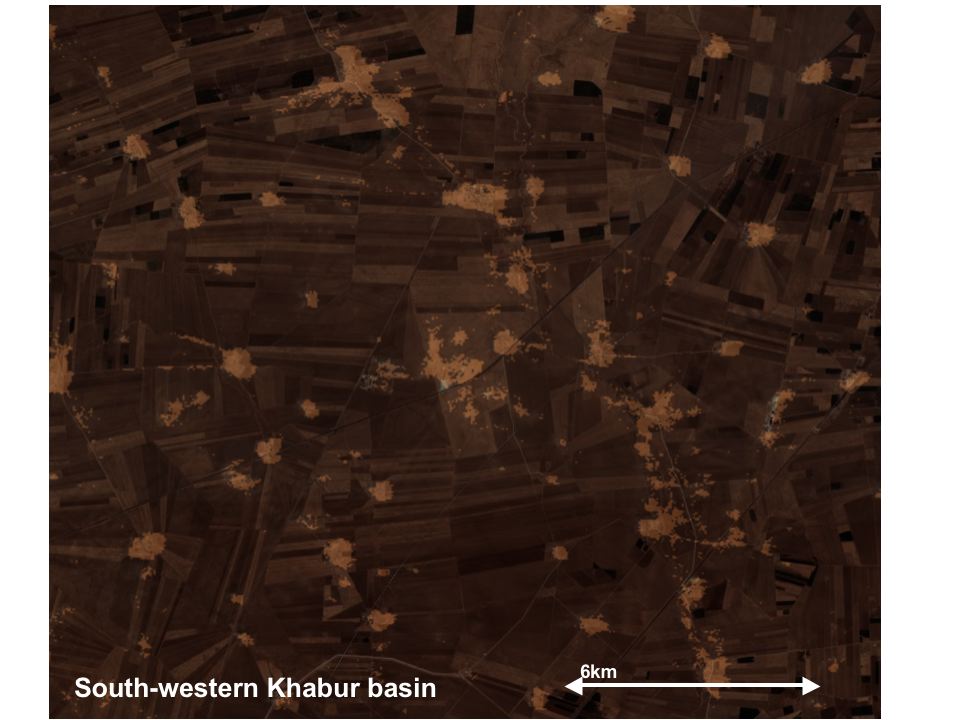
(Copyright: Google.)
The potential of the ASTER classification in its use for a local survey can be assessed when comparing the information of standard high resolution imagery (top image above) with the outcome of the classification (bottom image above, tell-like soil marks indicated by brighter colors). Future steps will be the prospective evaluation of the results on the ground and the combined application of SRTM and ASTER based search for ancient settlement sites.