 Occasional Papers (2009-)
 Site Visualisations
1. Virtual Globes and internet GIS
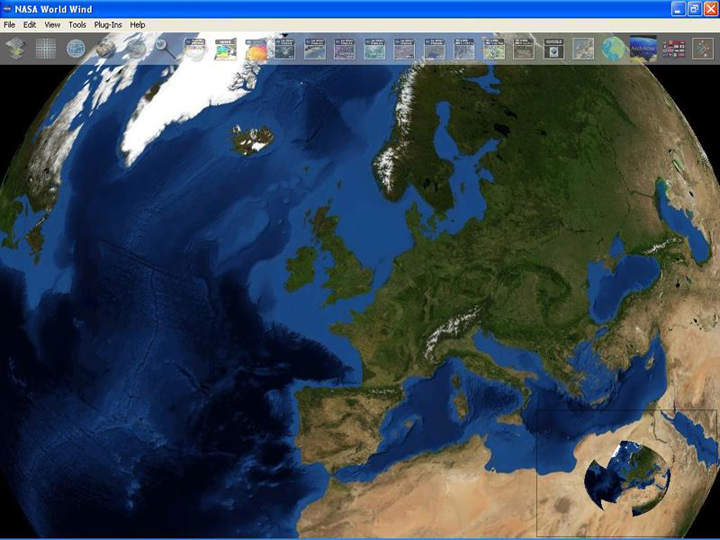
As with many technological innovations, there has been plenty of hype around virtual globes such as Google Earth or World Wind, and media interest in 'armchair archaeology' has been high.
Many people will remember the first time they ran Google Earth the visual impact of the imagery and its animated function were certainly awe-inspiring, recalling the special effects of science-fiction film and television; or those first dramatic photographs taken by astronauts. But beyond the initial excitement of finding one's own house, and then flying to one's favourite archaeological sites in astounding detail, we should ask the question: so what? Taking a step back from the enchantment of the visuals, how can this technology be used productively in or for archaeological research? How new are they really, these new technologies?
Of course, computer-generated landscapes using satellite and geodesic data for terrain modelling and mapping, have been used in archaeology and other disciplines for some time. (Terragen, ERDAS Imagine are amongst some of the more common and still useful tools). But none have been as easy-to-use, so globally comprehensive or, crucially, freely available as Google Earth or WorldWind.
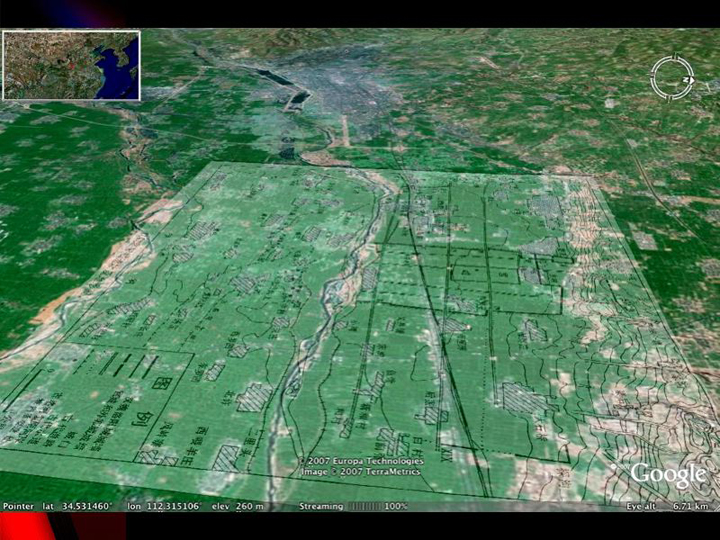
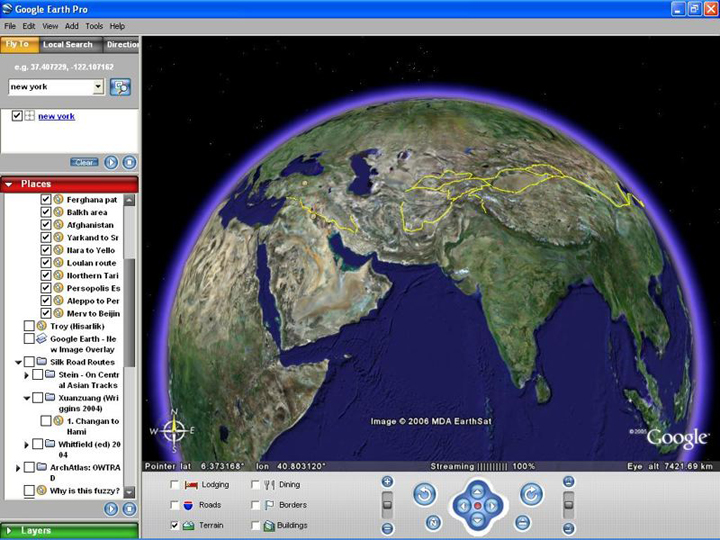
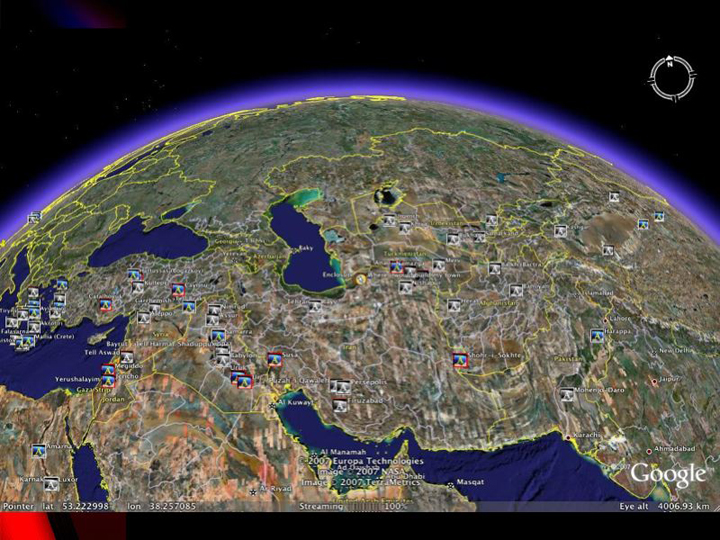
These virtual globes cannot be said to be full Geographical Information Systems, currently lacking various integral manipulation facilities, and there are many applications for which traditional GIS programs will still be vital. However for many functions, they provide the quick and easy mapping needs required for looking at geographical positions and adding basic data overlays, such as this overlay of the ancient Chinese capital of Luoyang on Google Earth.
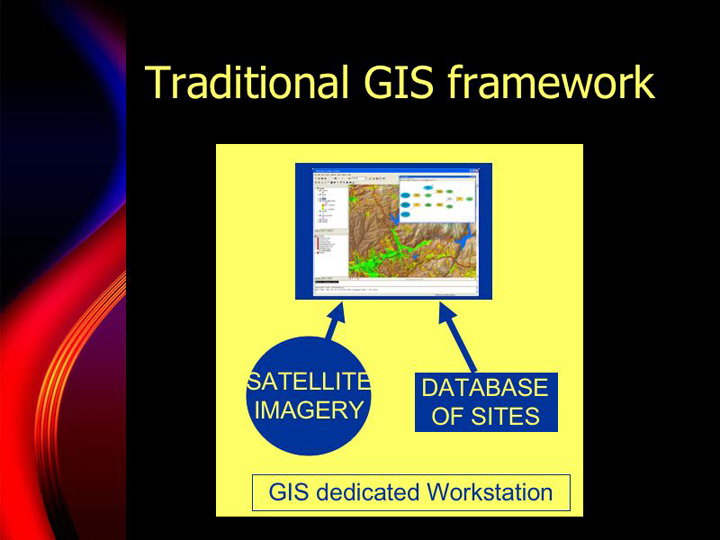
The institutional origin of Google Earth, specifically an internet search engine company, offers a clue to the fundamental technical shift currently taking place away from older GIS approaches. Traditionally, it has been necessary to keep data for GIS systems (whether that be vector data providing boundaries or place-names, raster data such as satellite imagery or point data such as site locations) on a local high-specification computer for use in ArcGIS, GRASS or similar GIS systems.
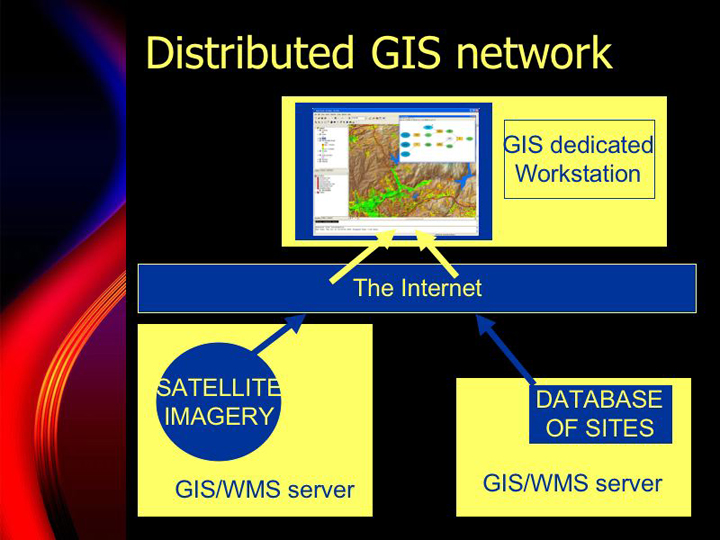
Increasingly, however, computer networks have come to play an ever bigger part in the distribution of data: rather than every individual keeping a copy of the satellite image on their hard disc, the data is downloaded by the client program when it is needed.
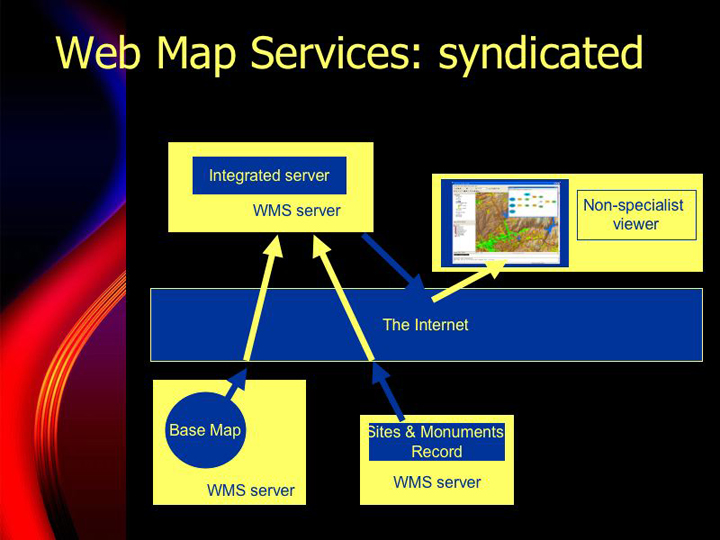
'Web Map Services' (or WMS) such as ArcIMS or MapServer, allow the creation of a 'distributed' geographical data network. As an archaeological example, a public archaeological service might have a WMS system which returns the position of all recorded archaeological sites in the region as a map, while a national mapping service might have a WMS system elsewhere which returns a base map of the region. A user who has a compatible client program (such as ArcGIS, GlobalMapper) can combine these two data sources together to produce their own map: indeed, if the copyright permission allows it, they might run their WMS service which combines the two other sources into a single service. Thus the potential permutations of this form of geographical 'syndication' are endless.
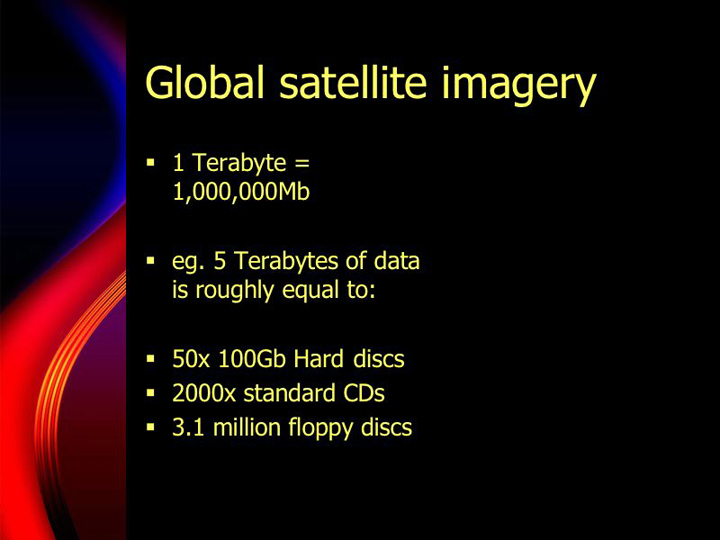
Both Google and NASA have access to extensive server capabilities and massive storage capacity. This allows them to keep a centralised store of huge amounts of satellite imagery and geographical data, and, on demand, serve them extremely quickly to clients across the world. To store all the necessary data at full resolution for the entire world on a personal PC would take many terabytes of information, perhaps 10,000 CDs-worth.
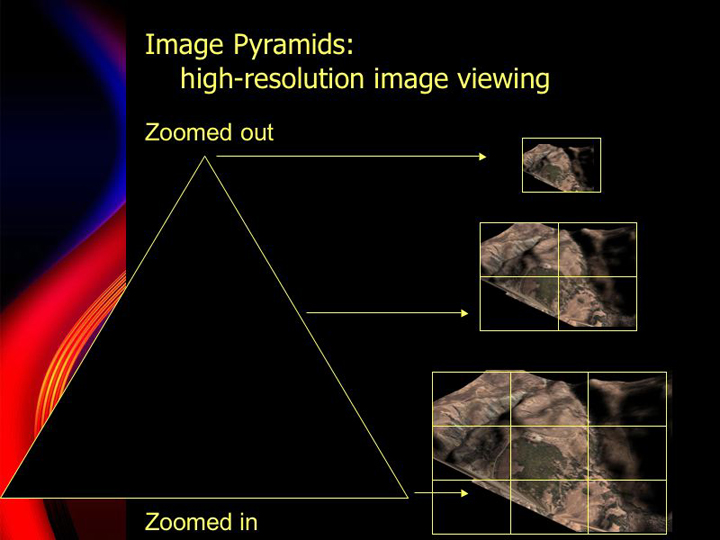
Large images are broken into 'pyramids' so that the client programs (GE & WW themselves) only download the imagery at the required detail when needed.
The cost of the highest resolution satellite imagery is also normally problematic for archaeological researchers (a single 5x5km square Quickbird image costing around 1500 euros to order) and on this global scale, prohibitive.
Until recently it had also been difficult to store and even manipulate large datafiles such as the LANDSAT imagery for the average user. However, the unique economy of scale formed by Google's advertising revenues, or NASA's huge public budget, combined with increasing broadband and computer speeds, has facilitated a not-so-quiet democratisation of high-resolution photographic access to the world's surface.
This 'dynamic geographical service', in which data is distributed, also allows the potential for multiple data sources and integration. Google Earth makes it extremely easy to add data for both casual users and more advanced programmers, and then share it with others. Points, lines, polygons and overlays can be added from within the program, and then exported as a KML or KMZ file. Using Google's SketchUp program, three-dimensional models can also be added to the scene.
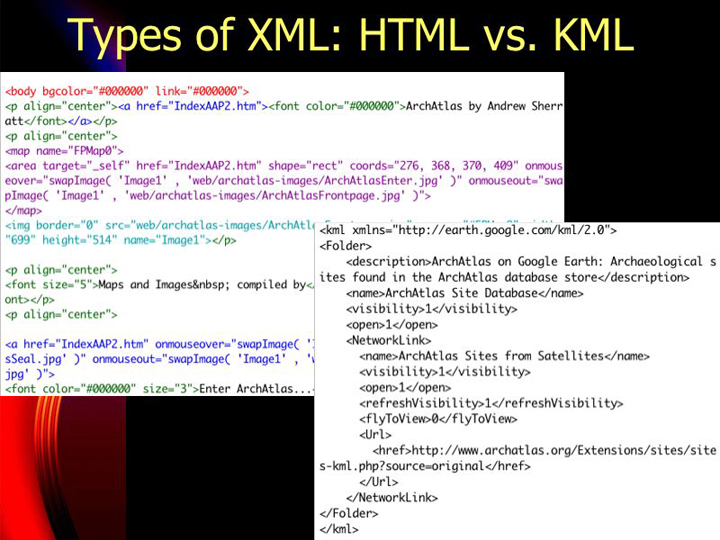
Underlying these features is a form of XML (eXtensible Markup Language) called KML (Keyhole Markup Language) in Google Earth or WWXML in WorldWind. Like HTML, this is a markup language which allows you to specify the way in which a file is interpreted, and therefore plotted by the browser (in this case the 'geobrowser'). KML is very straightforward to master for anyone who has written HTML web pages, and this means that most good web-designers will also be able to write dynamic KML services (using PHP, Python, SQL or whatever), with relative ease. [Note: There are also a number of other XML schemes with similar purposes: GeoRSS for syndication of blogs with geographical features, or GML for more advanced geographical data types.
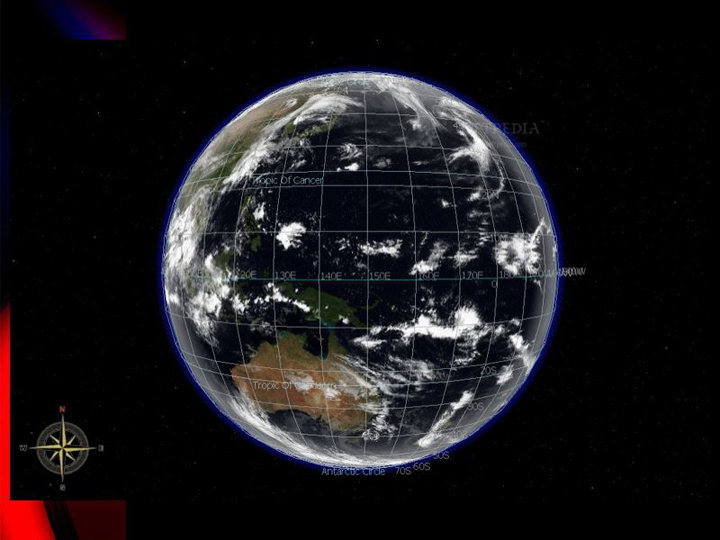
'Network links' for Google Earth, or plugins for WorldWind, allow user-chosen data, such as recent earthquakes, or current global cloud cover to be downloaded dynamically across the internet and so kept up-to-date.
The ArchAtlas extensions (ArchAtlas Virtual globes) use these facilities to keep the Sites-from-Satellites and Open Archaeological Atlas database up-to-date, with links to relevant webpages.
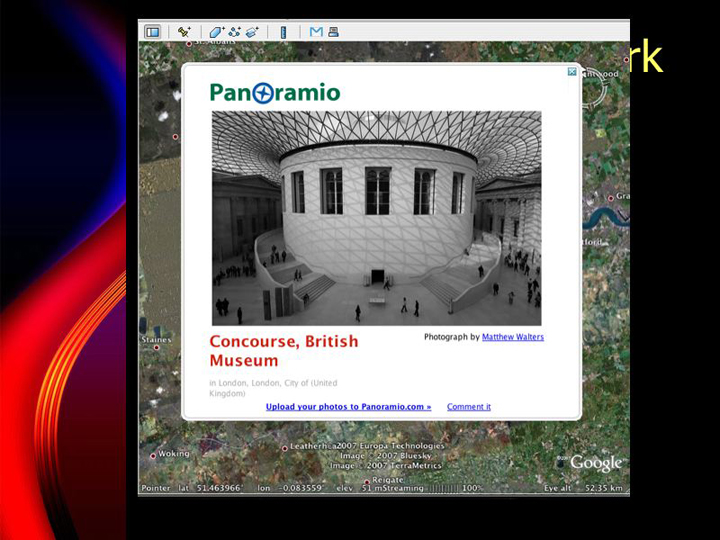
The internet-wide response to this easy way to add geographical information has been the trend for what is known as 'geotagging': for example services such as Flickr (http://www.flickr.com/) and Panoramio (http://www.panoramio.com), sites for sharing photographs and images, now include a feature to specify the geographical co-ordinates of an image in Google Maps, GE and others. Wikipedia also includes co-ordinates for many of its encyclopedia entries.
The result is a 'semantic globe': the unlabelled features of the raster satellite imagery are being slowly overlain by textual and further visual information in order to make them meaningful. This is a simultaneous process of digitisation and spatialisation of all kinds of data into a global geographic grid. Archaeological data is no exception to this.
2. Archaeological geotagging: trends in internet archaeology
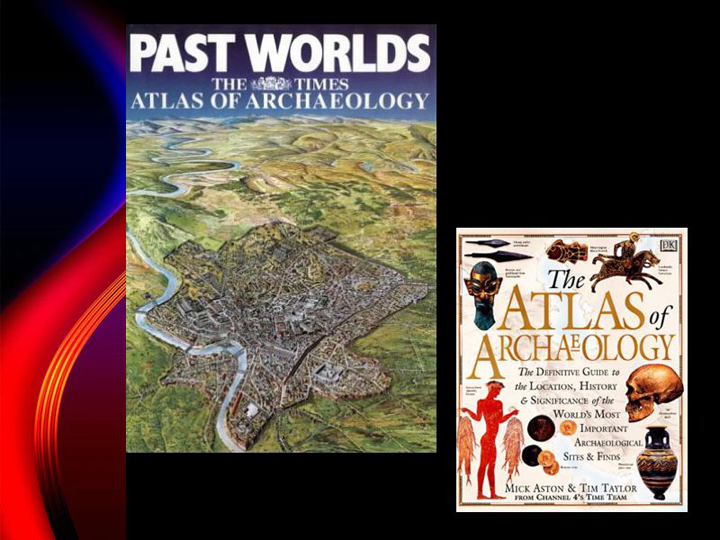
Traditional paper atlases of world history have long been a popular and essential part of archaeological learning, dissemination of information and global comparisons of archaeological phenomena. In general they have come in two flavours: popular yet cursory; or else magisterial yet prohibitively expensive, both to publish and to buy. In both cases however, the information contained often becomes rapidly dated as further research reveals new sites, new finds and new approaches which alter established views and interpretations of the historical process.
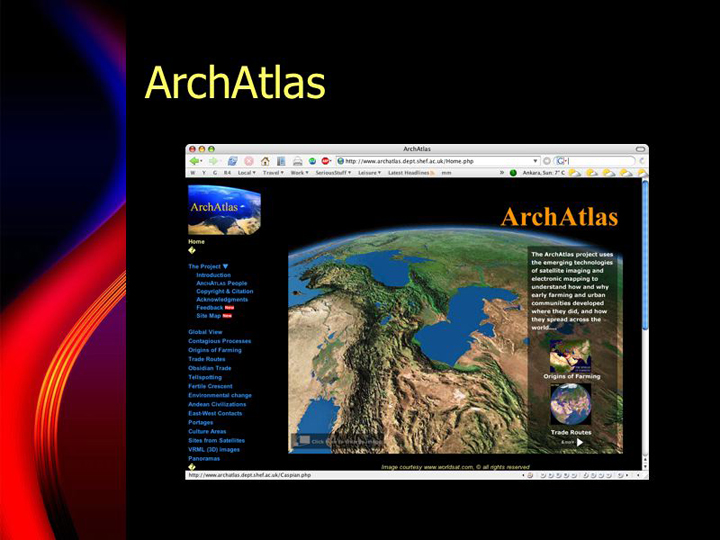
The technological possibilities of the internet, as Andrew Sherratt already showed us with ArchAtlas, now offer us a way to change the way such information and visual summaries can be presented. The ArchAtlas imagery is, though, for the most part static, which of course makes sense for interpretive essays where one wants clear visuals, but if the site is to provide a strong reference service, the background archaeological data must be reliable and dynamically updateable.
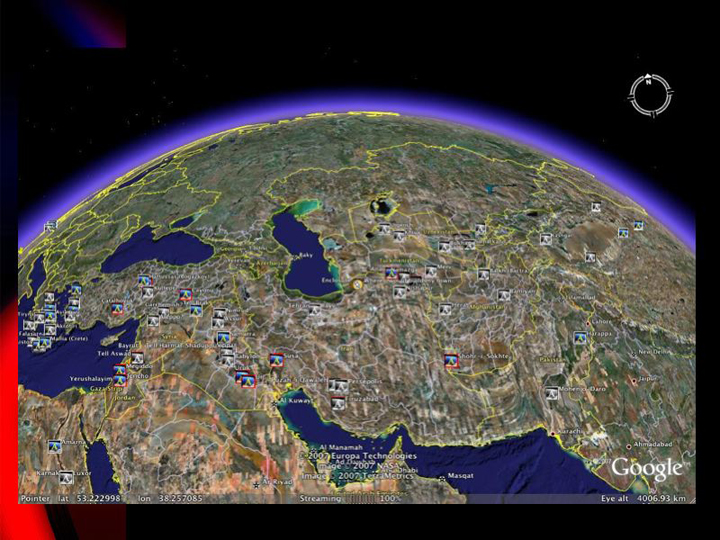
Virtual globes and internet mapping functions offer an obvious way to make this possible. As yet, the full potential of plotting dynamic archaeological data on visualisation programs (both visual globes and other internet mapping schemes) has, I think, hardly been tapped: locations of large sites and a few overlays are pretty much the only applications I have seen available for Google Earth.
But the point overlay features of Google Earth and WorldWind could be equally useful to depict raw material sources or individual find type locations; and landscape surveys could easily publish their sites location or find distribution information online in this way and link to further data about the sites.
Beyond individual points: there are clear opportunities for:
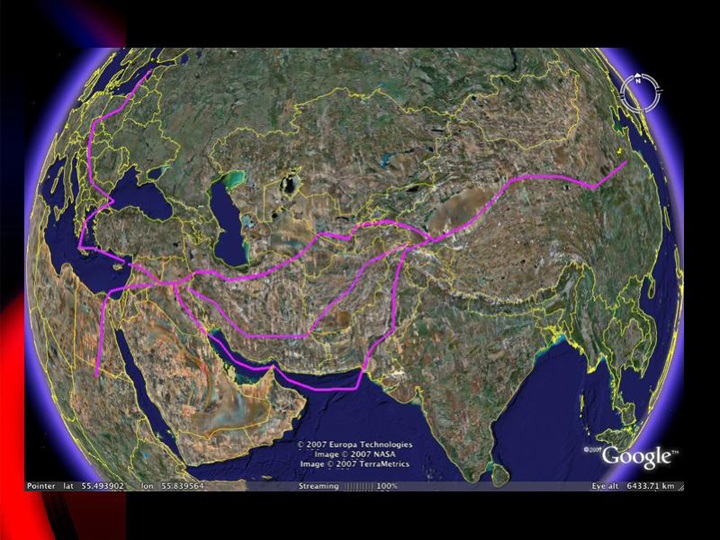
(1) depicting trade routes or movements of various kinds as line polygons
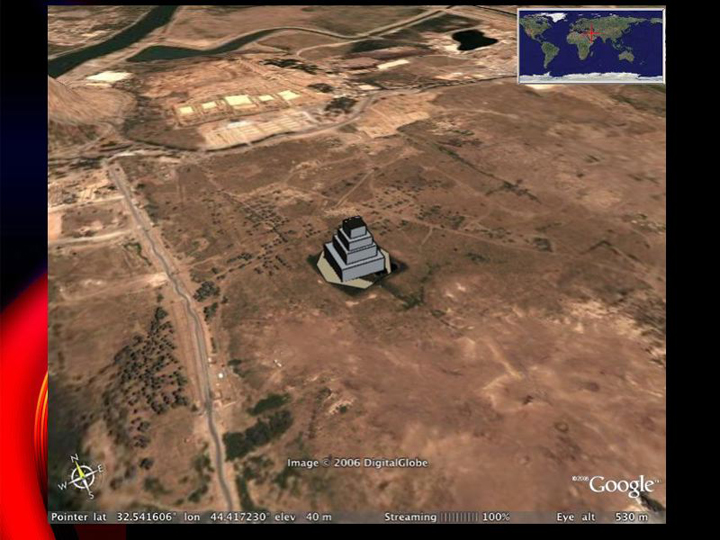
(2) ancient buildings as 3D models
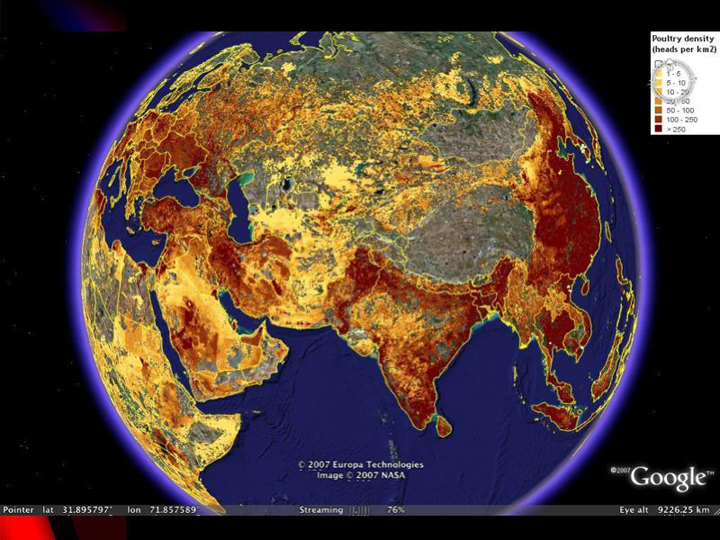
(3) distributions in density map form (compare, for example this density map of the distribution of chickens in Declan Butler's bird-flu tracking extension for Google Earth).
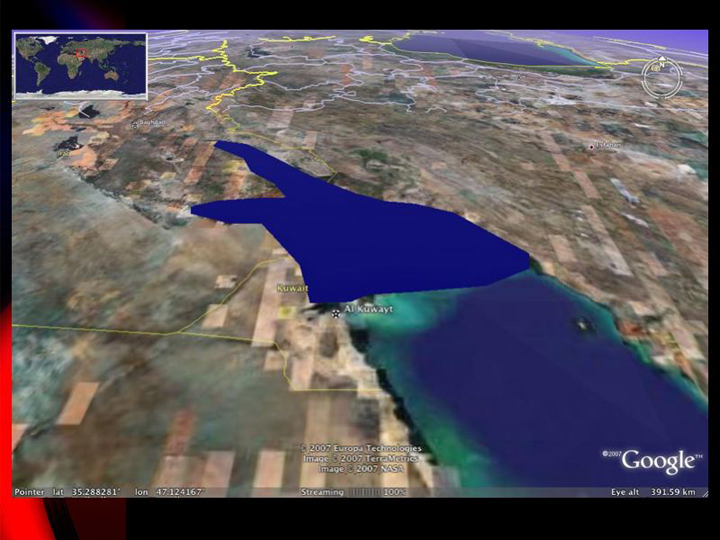
(4) environmental changes as image overlays (for example sea-level and alluvial such as in southern Mesopotamia cf. ArchAtlas Environmental change)
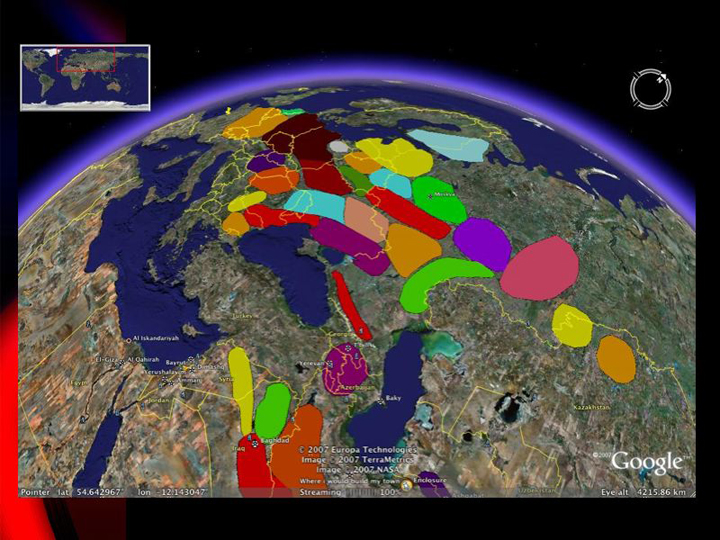
(5) or culture areas as fluctuating coloured polygons (this is a screenshot of an experimental extension for Google Earth of WorldWind).
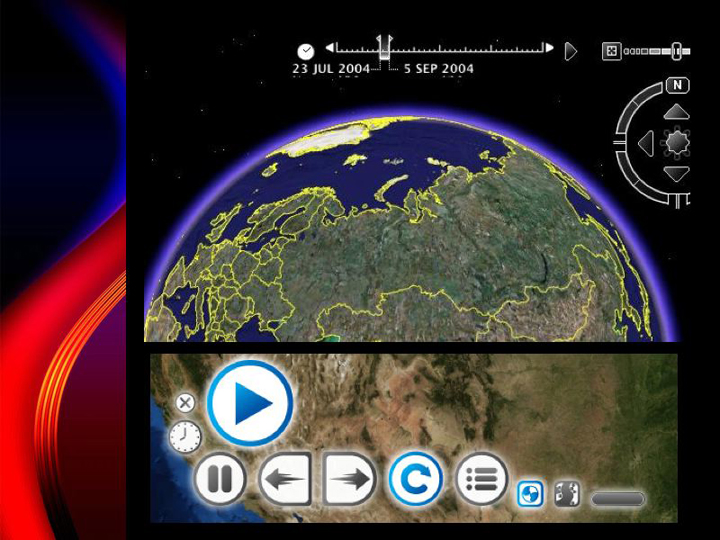
(6) Further and so far underexplored, both Google Earth and the upcoming WorldWind version 1.4, include time as an additional component of data description and interaction. This will form a key part of the future of archaeological visualisation of long-term processes: rather than snapshots, we may begin to visualise more and more historical processes, such as urbanisation, as continuous animations. All these have precedents in paper atlases: but the advantage of the online version is (i) its ability to remain up-to-date, (ii) the nature of the internet means that experts from across the world can contribute simultaneously and publish much faster, and (iii) the information can be animated into filmic or media-rich formats.
But developing these visualisations is not straightforward. As was learnt trying to put together many of the pages for ArchAtlas, it is often extremely difficult to find accurate site co-ordinates. There are paper sources for certain regions and periods (which I will talk more about in a minute) but co-ordinates may be given in less common projections so need to be converted, and the precision is often low.
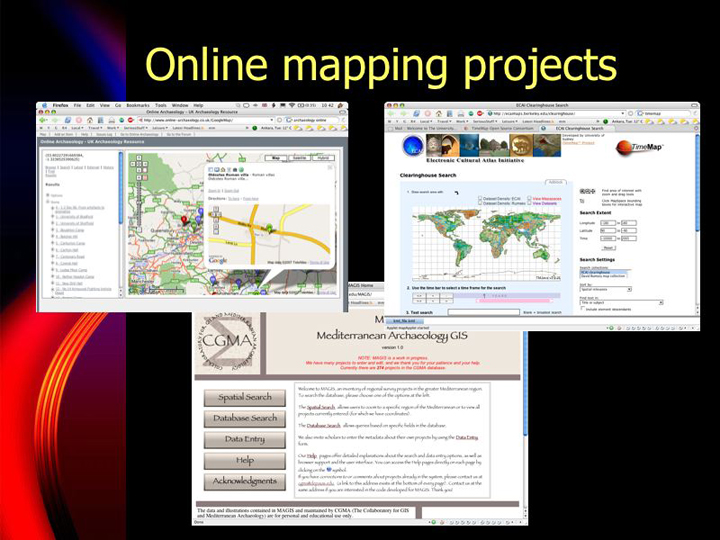
This is where archaeological practice is now beginning to catch up, as many different projects and institutions plan web-based and GIS-enabled databases of archaeological information.
ArchAtlashttp://www.archatlas.org,
MAGIS http://cgma.depauw.edu/MAGIS/,
Online Archaeology http://www.onlinearchaeology.co.uk/,
FASTI http://www.fastionline.org/,
ASPRO http://www.mom.fr/Base-de-donnees-ASPRO-Atlas-des.html,
Doc Savage's Jordan online http://archaeology.asu.edu/jordan/index.html,
TAY http://www.tayproject.org/,
ECAI TimeMap http://ecai.org/epubs/TimeMap.html.
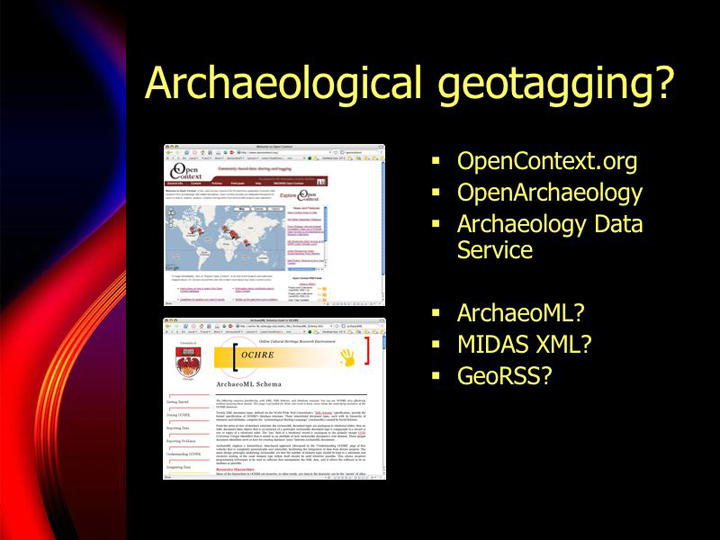
As yet, no archaeological equivalent to ubiquitous 'community-driven' sites such as Wikipedia, Flickr, Panoramio, has become dominant: but the publication of spatialised archaeological data, what we might call archaeological geotagging, is likely to become increasingly important. Some projects (Open Context http://www.opencontext.org/) are also beginning to use integrative database schemes such as ArchaeoML (another schema of XML) to make excavation, survey and other data more widely accessible on the web – a scheme which will soon be integrated geographically.
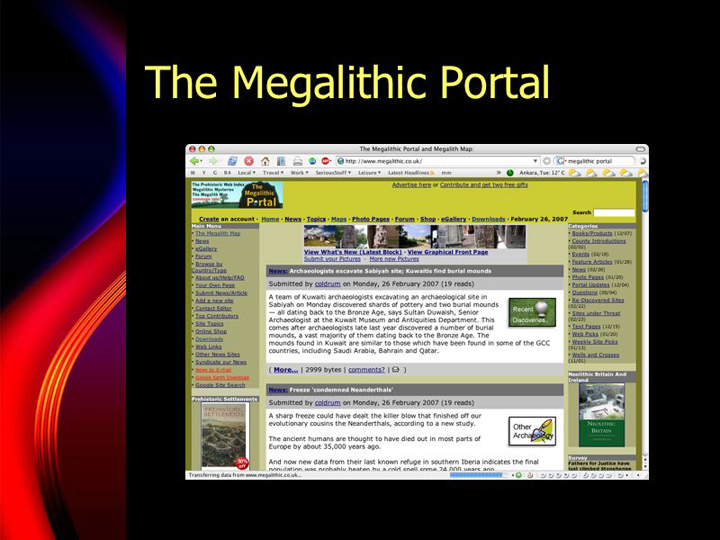
The Megalithic portal (http://www.megalithic.co.uk), for example, is a website which has relied on contributions from its readership to collect large numbers of GPS co-ordinates for Megalithic sites across Europe.
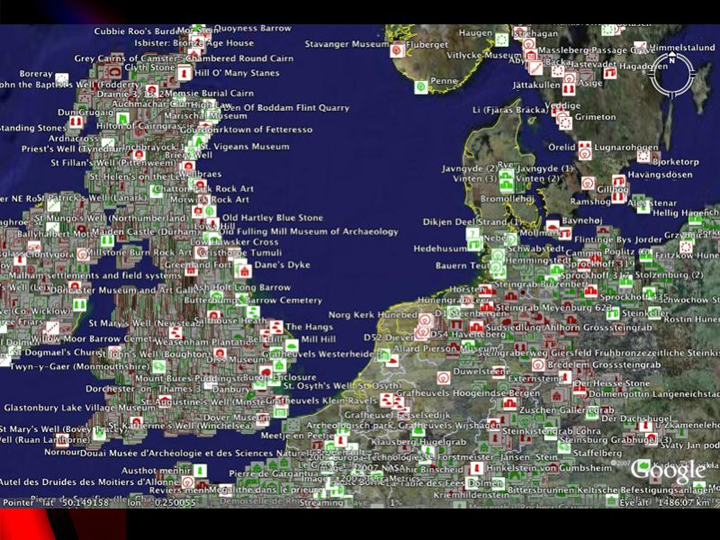
They released a very substantial number of locations, not all of them megalithic however, as a single file for Google Earth and also have their own online mapping interface.
Concurrently, the Google Earth Community website http://www.keyhole.com also provides a forum called 'History Illustrated' which allows any user to 'post in' their own collection of placemarks, polygons, overlays and three-dimensional models.
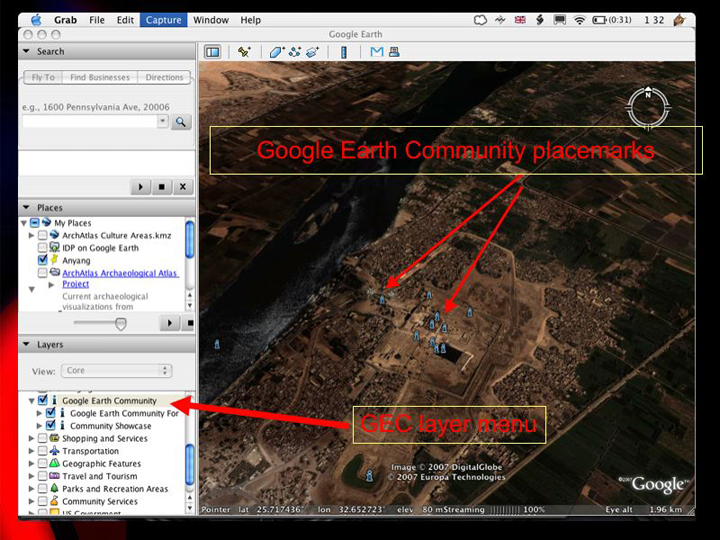
The result is that switching on the 'GEC' layer in Google Earth immediately shows placemark labels which include many well-known archaeological sites or monuments. Those who have used this facility will know that care must be taken with taking labels at face value: as with other information sources on the internet, quality varies immensely. For example, many placemarks are inaccurately or imprecisely placed (indeed we had this problem with the original ArchAtlas dataset when the dramatic increase in resolution suddenly showed quite how imprecise our source databases were; this also happened with the UNESCO World Heritage Sites list (GEC page http://bbs.keyhole.com/ubb/showflat.php?Number=38862).
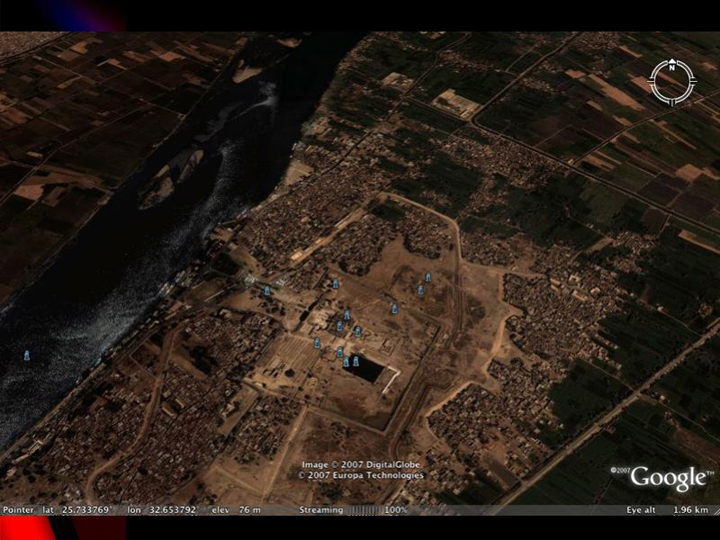
Cumulative labelling by different people in the community often provides a more solid identification of sites, but if there are only two options, it is difficult to be able to judge the reliability of either.
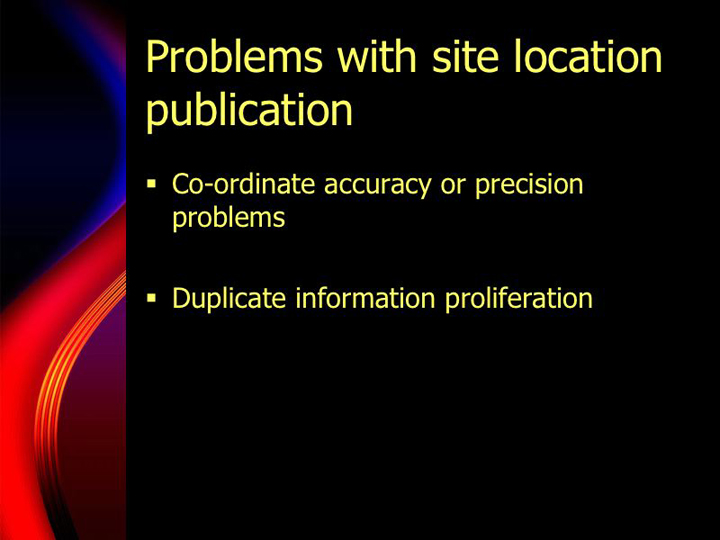
Both these examples (GEC & Megalithic map) are potentially useful sources of locational information, but they partly illustrate two important challenges: (1) firstly the obvious difficulties of co-ordinate precision and accuracy, and (2) secondly the confusion created by increasing numbers of sources of locational information. How can the average archaeological user make a judgement about the reliability of any one particular co-ordinate? As other types of archaeological information are published online, how will the various sources be best integrated, accessed and made useful for both research and teaching communities?
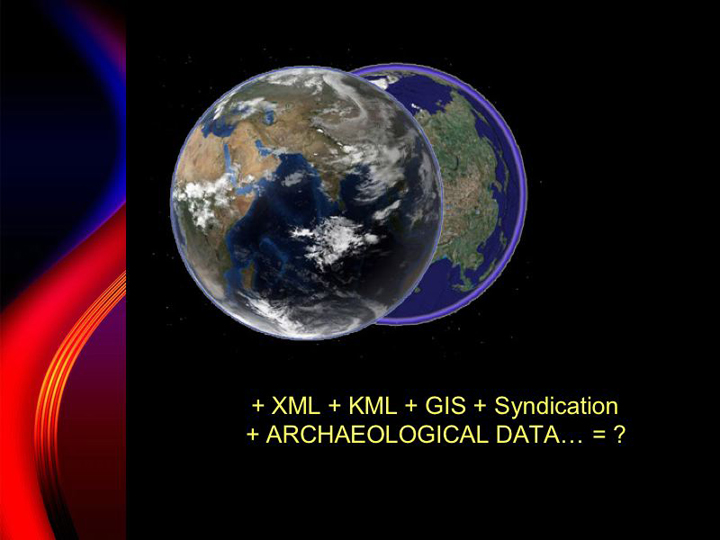
3. A global atlas, internet databases and syndication practices
There are two possible answers to this: a short-term patch, and a longer-term strategy.
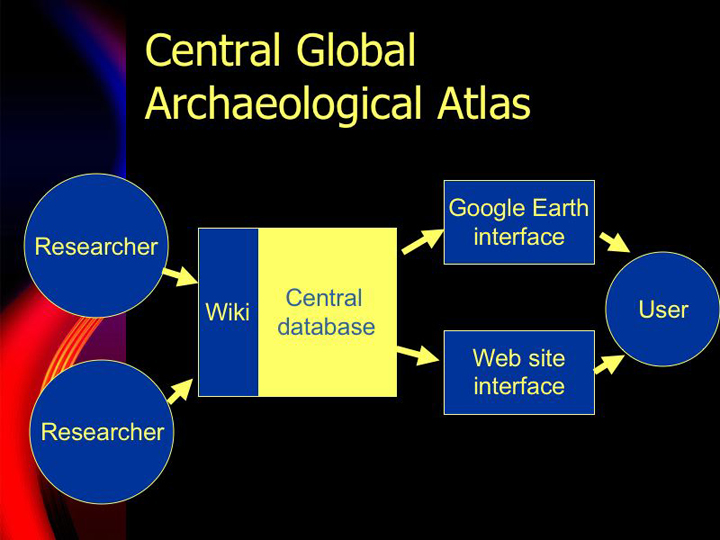
The former would involve the creation of a central global archaeological atlas database which relies on contributions from researchers who donate their geospatial data to the database with attributions and links to further information. A good digital global atlas must be authoritative and trustworthy, and thus will require a careful process of verification. But the verification process is impossible for one researcher and it could only be practical with a collaborative process of regional specialists. One could easily house this kind of database on a single server, such as ArchAtlas, using some form of Wiki-style system so that researchers can log-in and add, modify, and add notes to data, allowing both greater reliability, recognition of their contribution, and potential for debate.
Of course, the first question is how do you persuade people to give their time and data to such a database: what incentives are there for a researcher to donate information collected about their own sites or for their own research to a more general project like ArchAtlas? To what extent will projects such as landscape surveys be willing to freely share their data or prefer to maintain the data within their own systems and websites?
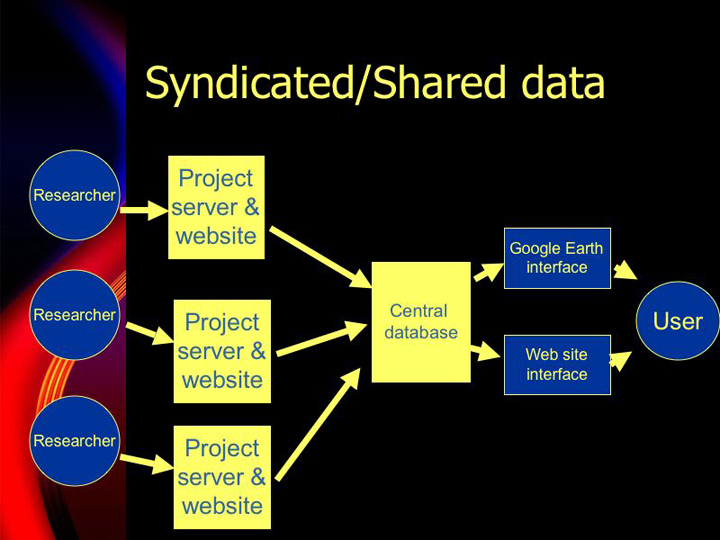
Indeed, would it be beneficial (long-term) to develop some form of syndication system with the central database as a 'linking mechanism', whereby ArchAtlas would act as a portal for the combination of various good data sites, but which would each have to maintain their own databases online? In the longer-term, such a system of semantic data sharing and syndication would be far more flexible and powerful, but also more complex to set up, requiring agreed standards on data formats which do not yet exist.
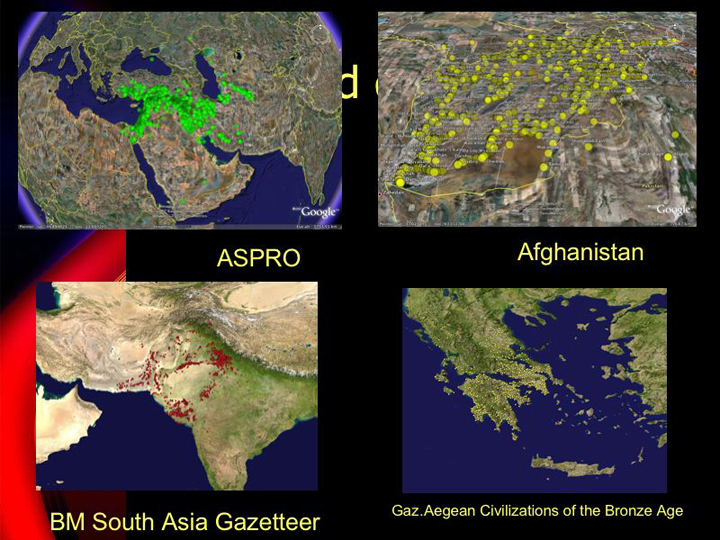
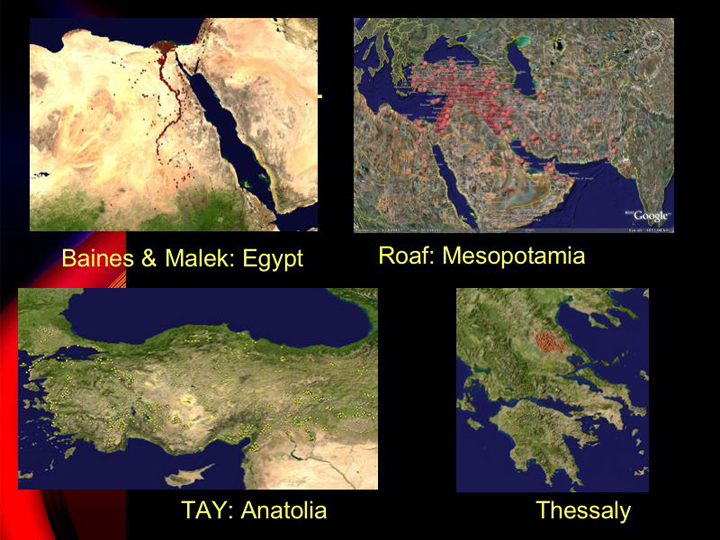
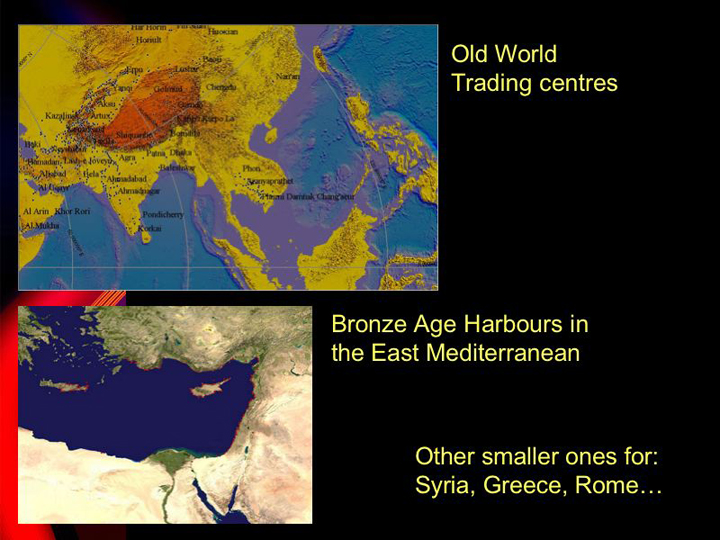
There is already substantial extant co-ordinate data in the form of gazetteers of archaeological sites, which could easily be converted to the electronic format. Though many of them are far less precise than the current satellite imagery, they at least show a substantial proportion of sites to within a few kilometres. For example, the ArchAtlas project digitised data from many different sources over the last couple of years - including data from the following sources: Old World Traders Project (Ciolek 1999), ASPRO (Hours et al. 1994), BMSAG, Archaeological Gazetteer of Afghanistan (Ball 1982), Gazetteer of Aegean Civilizations of the Bronze Age (Hope Simpson & Dickinson 1979), (Levi 1980), (Baines & Malek 2000), amongst others. What remains unclear sometimes, and one of the reasons these have so far not been published on ArchAtlas, is the copyright status of such co-ordinate lists. Who owns the site location data? What are the rules and etiquette on re-publication of such material?

However, the most serious question which faces this whole initiative, is the issue of site protection. What happens when the precise location of archaeological sites is available to anyone on the internet? How can we protect sites from high-tech looters? If we are to release site co-ordinates online, in what format would we release the data? For example, the co-ordinates could be made accessible only to bona fide researchers through a passwording system. Equally the co-ordinates could be crippled in precision to allow large-scale work but at the sacrifice of small-scale resolution. Alternatively, since looters often have much greater access to funds for site identification than the average archaeologist, might it be better to be completely open with the data in an effort to allow archaeologists to do their work more effectively and governments to better protect sites? The question is whether the trend for geotagging (both inside and outside the profession), will result in the inevitable publication of site co-ordinates, or whether an attempt should be made to control co-ordinate distribution.
4. Future paradigms: Global archaeological landscapes and software production
The 'reference' and teaching potential of a global archaeological atlas is perhaps obvious, but how can it aid research? Of course there are potential pitfalls in the nature of such a database system. Databases structure the questions that can be asked of them. Indeed I think there is often a danger embedded within the nature of a 'view from above' – i.e. the use of mapping technologies and satellite imagery to visualise human history – that the experiential aspects of the spatial lives of past human societies may get lost. Obviously care should be taken that the archaeological imagination does not get siphoned into a single database or computerised track.
But in the not-so-distant future, I suspect the combination of virtual globes, advanced GIS and database technologies has the potential to initiate a paradigm shift in the nature of geospatial analysis, of information dissemination and even in the possibilities for innovative types of archaeological questions. The ability to zoom from god-like vision of the whole earth to the scale of individual houses or cars is not simply a gimmick but also a sophisticated way to come to understand global geography, and analyse concurrently various historical processes at different resolutions.
In the past, the main challenge for a concurrent global-local perspective has been the ability to control good archaeological data over large geographical and temporal spans, whilst maintaining a meaningful relationship between long-term cultural trends and small-scale details. A global archaeological atlas, which has the ability to link multiple forms of data together into a geographical grid, and visualise them using ever-advancing visualisation programs from Google Earth to ERDAS Imagine, increases the opportunities for micro- and macro-scale analysis of past societies.
With accurate site positions on a global scale, combined with high-resolution satellite data, global modelling of environmental patterns becomes increasingly possible, enabling a kind of 'global landscape archaeology'. As previously time-consuming mapping tasks become trivial for the computer using ever larger datasets, global comparative studies, Childean or world-systems-scale interpretations may be subjected to detailed empirical testing (cf. Sherratt 1997, Frank 1993).
At stake then, is our ability to move beyond current models of long-term socio-cultural and economic development, something that is definitely worth exploring further.