 Occasional Papers (2009-)
 Site Visualisations
During a term as Visiting Professor in Heidelberg in 2004-5, Andrew Sherratt expressed the hope that one day it would be possible to use pattern-recognition to pick out likely tell sites from satellite imagery. Björn Menze, of the University's Interdisciplinary Centre for Scientific Computing, proposed this answer in a seminar paper in February 2005.
See also publications in press

Following the observation that prehistoric and early historic settlement-mounds (tell settlements) in parts of the Near and Middle East can be recognized in the SRTM 90m terrain model (Sherratt, Antiquity 2004, see also Tellspotting on ArchAtlas), it seemed a good idea to develop an algorithm to do this automatically, using current techniques of computer modeling.
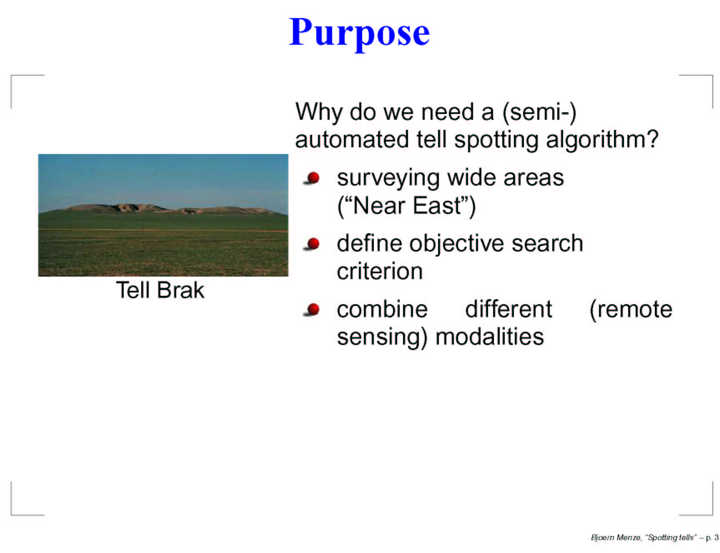
The advantages of an automated, pattern-recognition program for spotting tells are threefold. First, it allows the rapid scanning of large areas (the phenomenon of tell settlements stretches from south-east Europe to north-west India). Secondly, it provides a repeatable procedure, so that consistent decisions are made in identifying potential settlement-mounds. Thirdly, it makes it possible to integrate other information derived from satellite imaging, which may be useful in distinguishing settlement-mounds from others, natural or artificial.
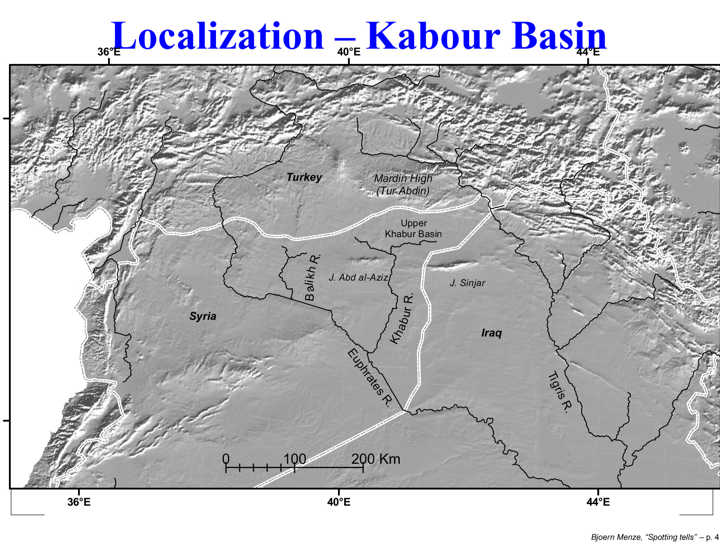
As a test-area, to teach a program to recognize mounds which were known to be prehistoric and early historic tells, a well-investigated area of northern Syria was chosen, the Upper Khabour (Habur) river-catchment. This has recently been intensively studied by Jason Ur (now Department of Anthropology , SUNY at Stony Brook, then of the Oriental Institute, University of Chicago), using CORONA satellite imagery. Map: Jason Ur.
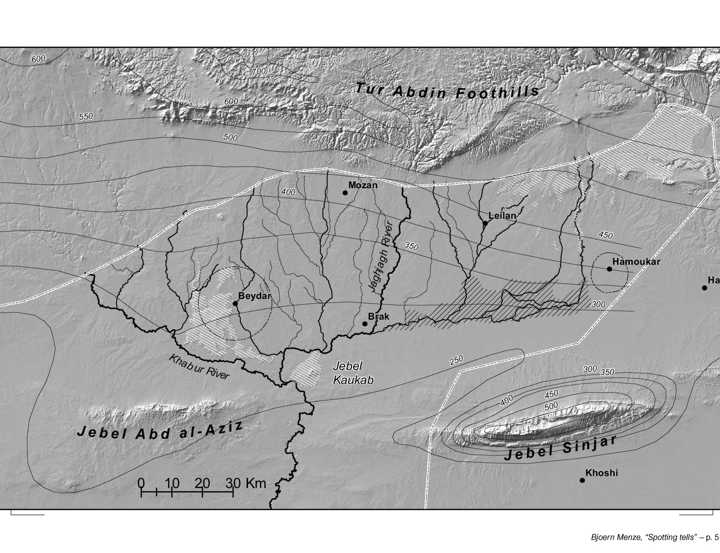
The study area includes major mounds which represent early towns and cities of the third and second millennia BC, some of whose names are known to us from ancient records: Tell Beydar (Nabada), Tell Mozan (Urkesh), Tell Brak (Nagar), Tell Leilan (Subat-Enlil), Tell Hamoukar. These major centres were surrounded by a dense array of smaller tell settlements and flat sites; Map: Jason Ur
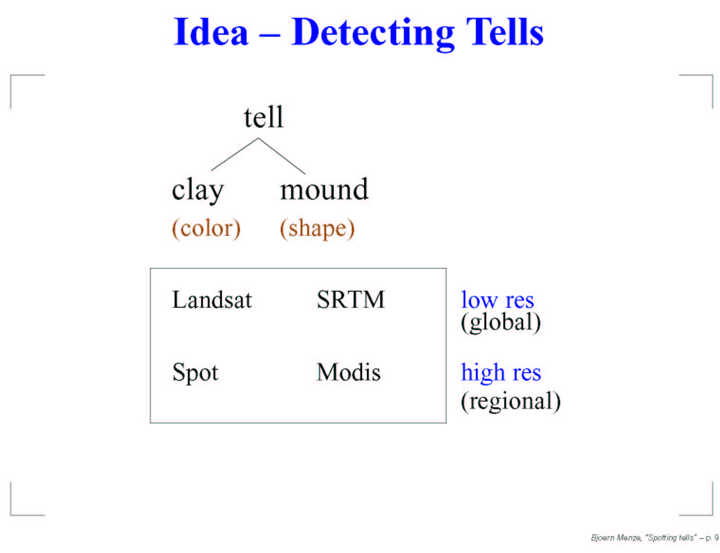
In order to recognize tells, clues can be provided both by the size of the mound and the material of which it is composed. Different satellite sources provide different levels of resolution and kinds of information. This experiment uses size (SRTM data) and false colour (Landsat 7 ETM Channels 7,4,2.).
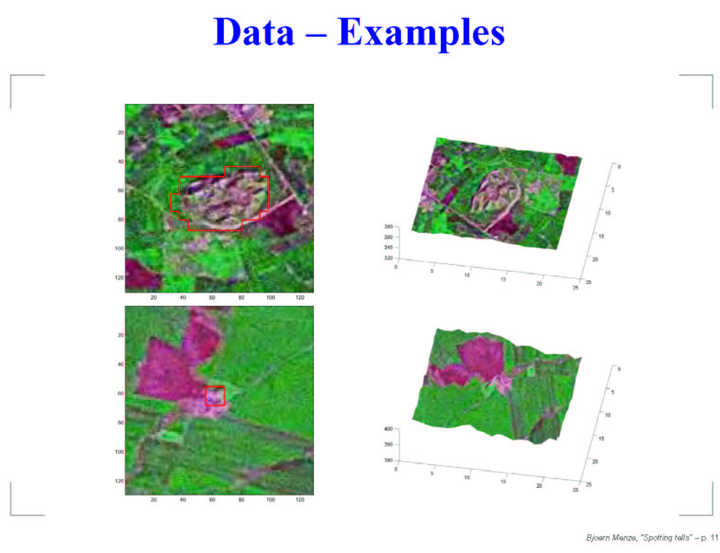
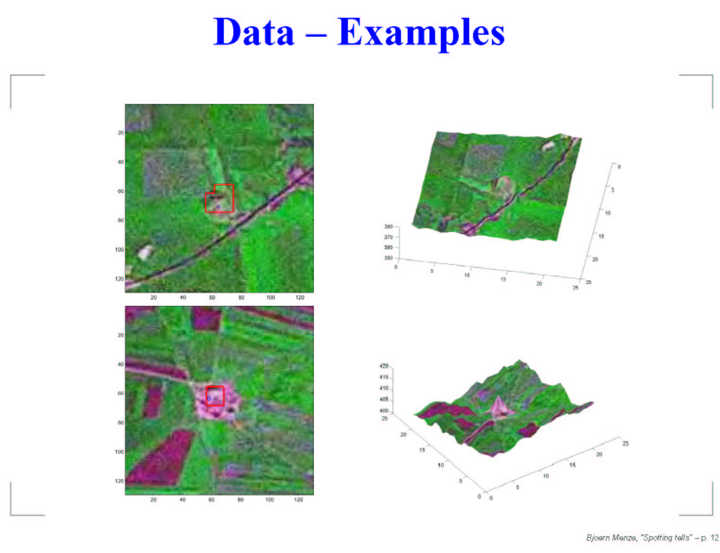
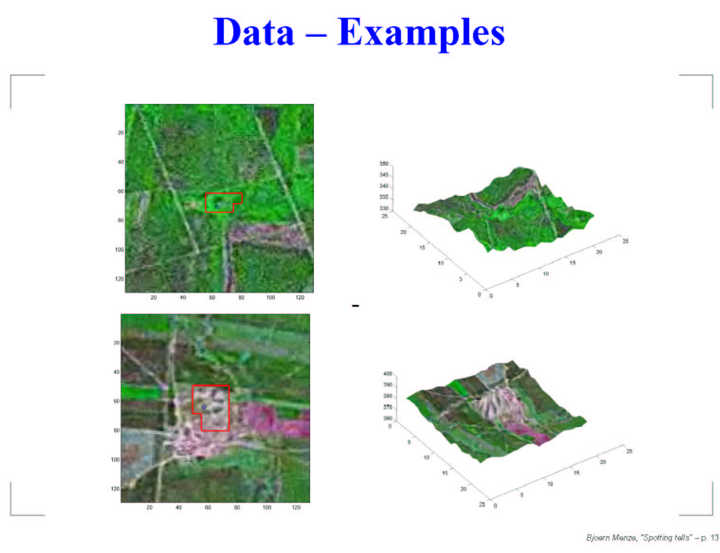
Landsat data were fused with the SRTM digital elevation model, and used to examine known tell settlements.
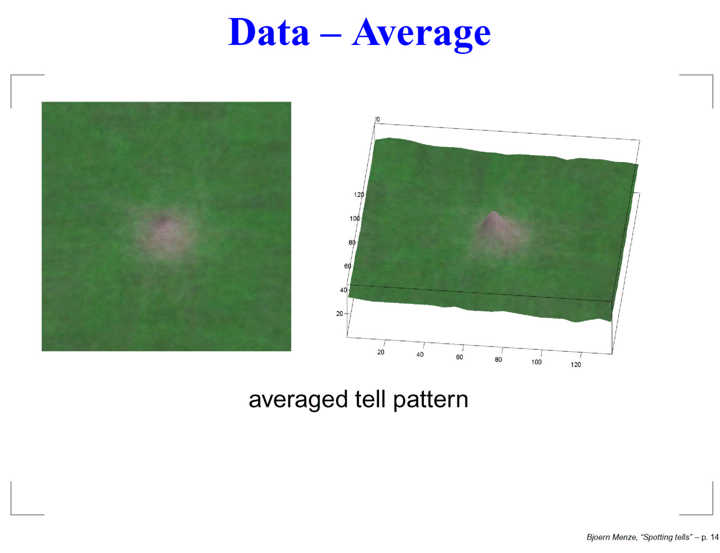
Having the information stored digitally allows it to be manipulated statistically. This is the average shape of 135 tell sites from the south-western Khabur basin. The height of the central pixel has been taken from each sample for the average shape model. The overlain image is the average of the SRTM and Landsat ETM+ data.
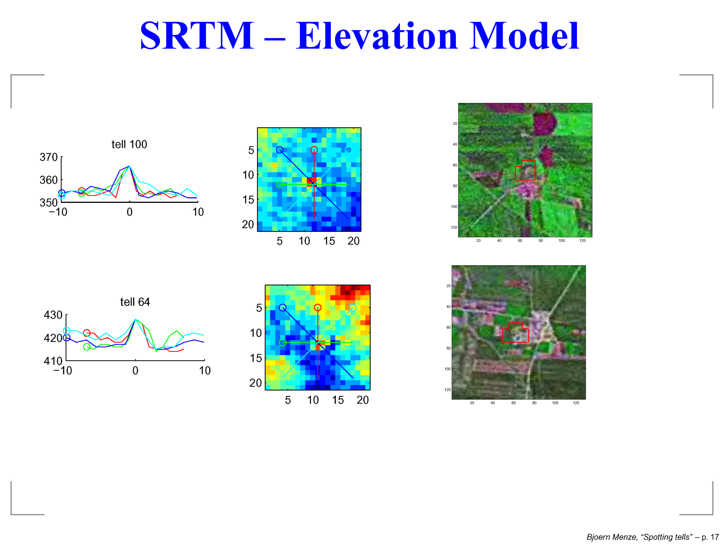
The conical elevation of a tell site (right) can be identified as a small bright 'spot' within the DEM data (centre). Height and diameter of tells are within certain ranges and provide a characteristic pattern (left, profiles indicated in the central images).
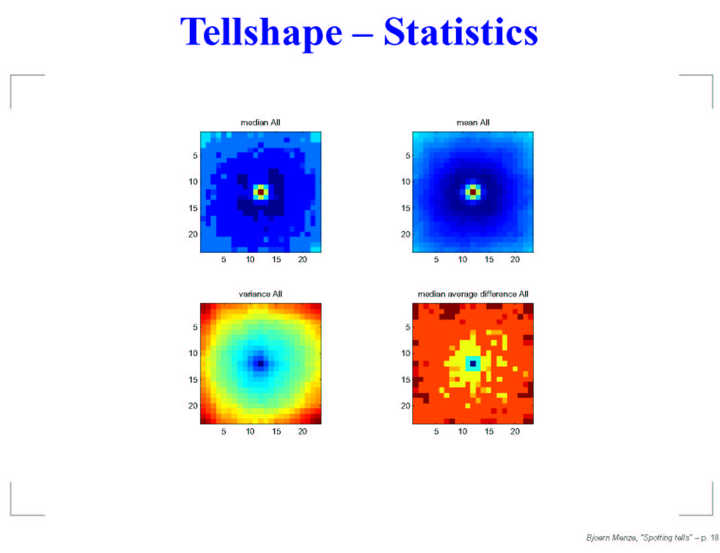
These can be treated statistically, by calculating average values and the extent of deviation (mean, median, variance).
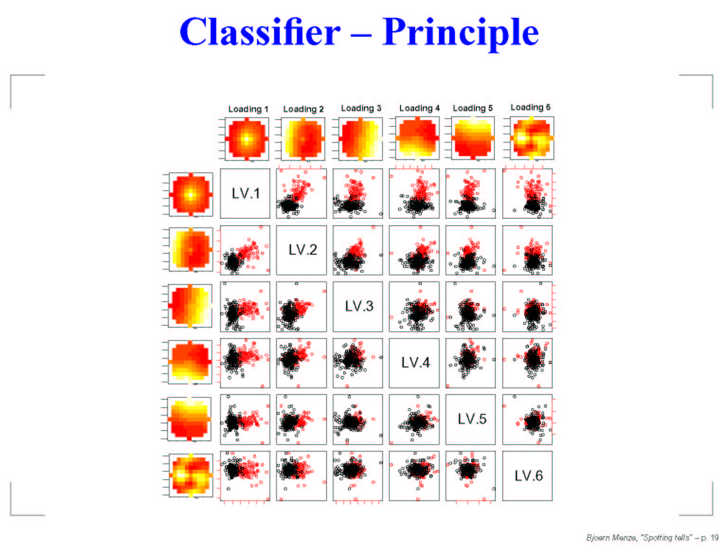
Filters can be created which have "learned" to recognise the patterns characteristic of known tell sites, and their multivariate responses can be used in the (semi-) automatic detection of tells.
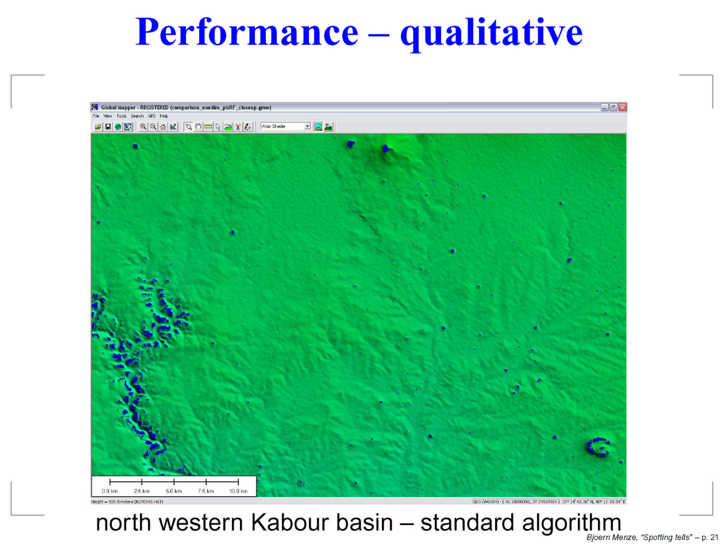
Potential tell sites in the north-western Khabur basin as indicated by a standard matched filter: besides tell sites it picked up erosional and volcanic features of the natural landscape.
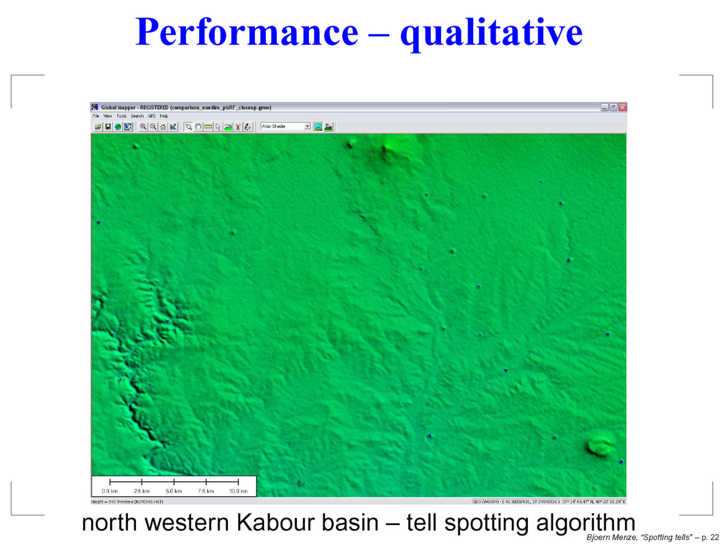
An adapted multivariate tell detection algorithm decreases the false postives significantly and allows for a (semi-) automatic and reproducible screening of SRTM tiles within a short time.
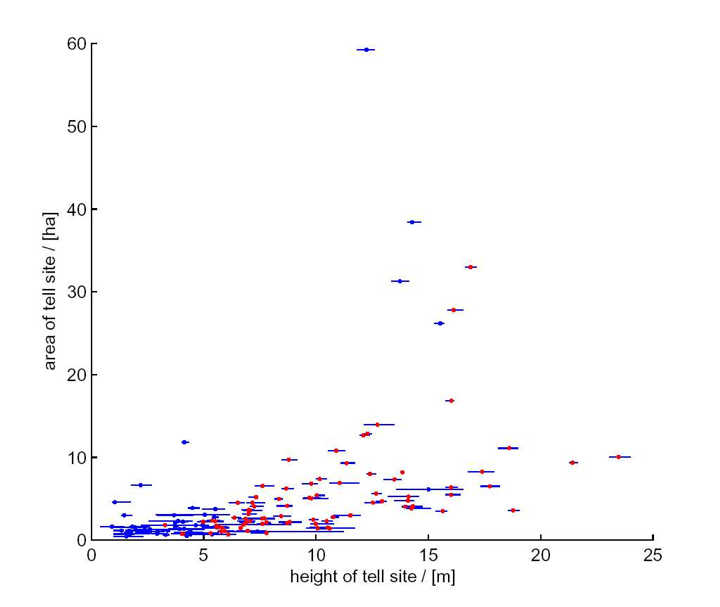
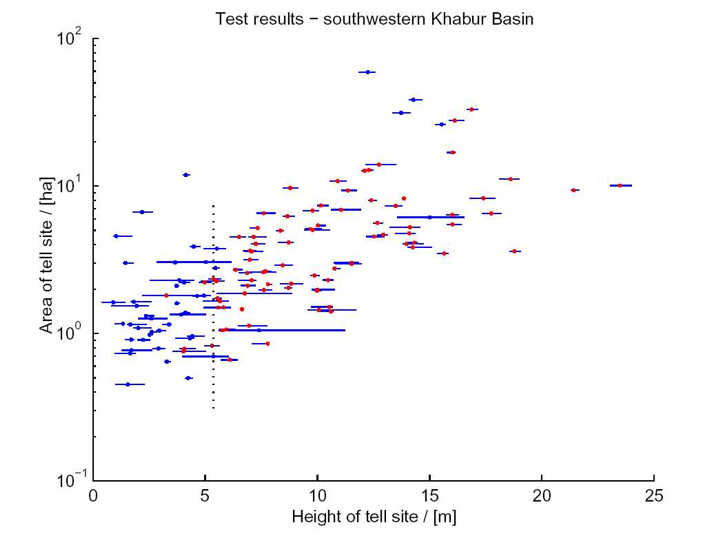
On a test set of 135 tells of the south-western Khabur basin, nearly all major sites higher than 6m can be detected (blue: missed, red: detected). Exceptions are due to "unusual" height/area ratios, which have not (yet) been learned from a training data set. (Above, linear scale; below, logarithmic scale).
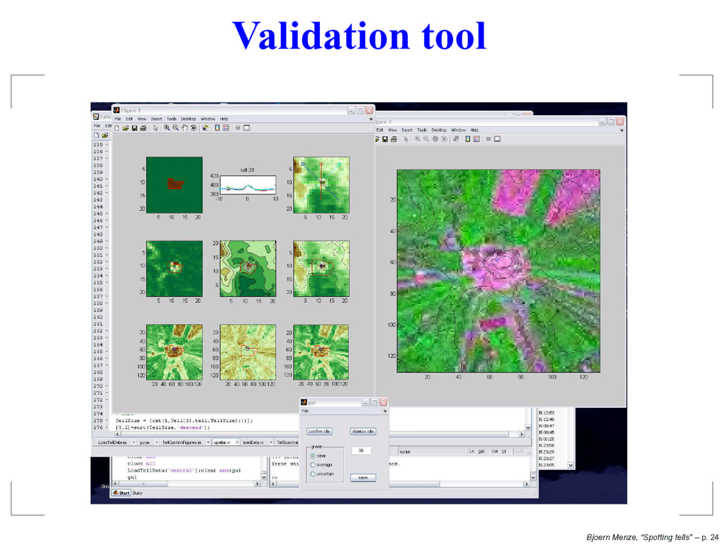
Screenshot of the tool for confirming sites proposed by the automatic recognition procedure, combining different imaging modalities.
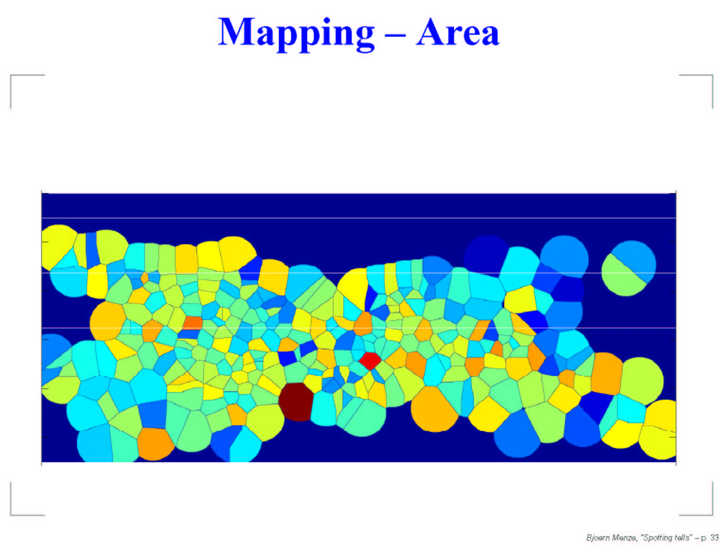
Nearest-neighbour tesselation of the Khabur basin with a mapping of the relative area of each tell site (blue: small; red: big; the major site in the south-central region is Tell Brak.
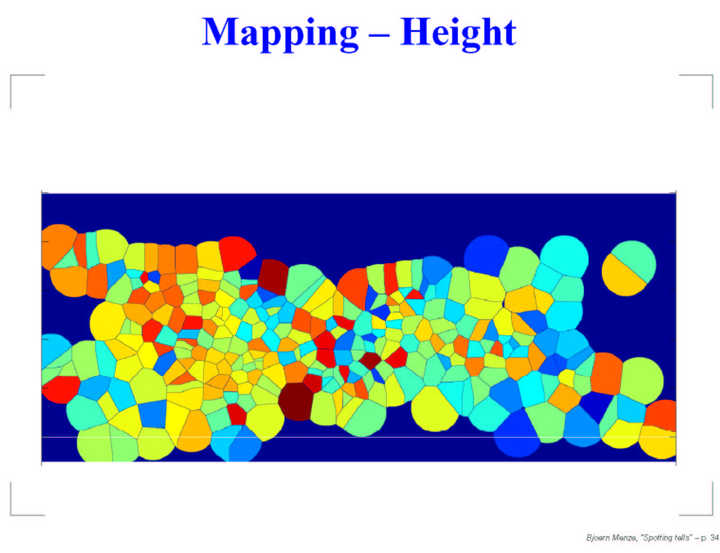
As above, with a mapping of the relative heights of each tell site (above the surrounding landscape, at the present day).
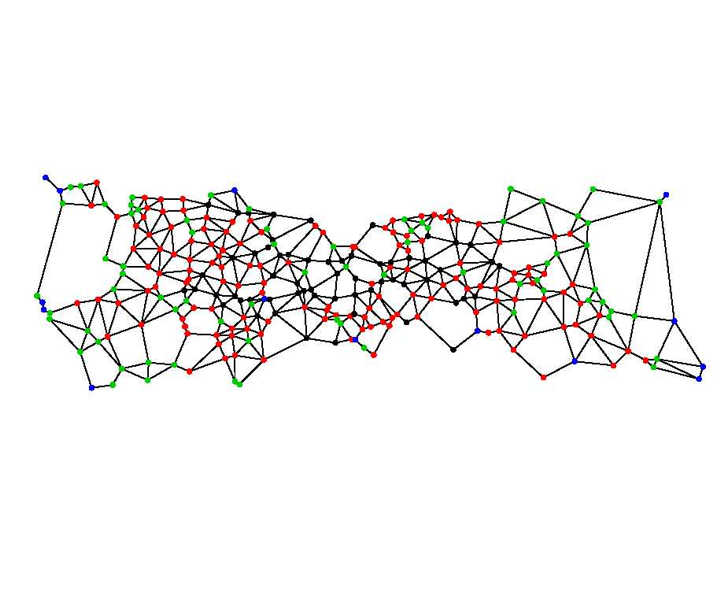
The distribution can be used to generate measures of connectivity within the network: this diagram shows a Gabriel graph of the tell 'network' of the Khabur basin. Colours indicate network 'betweenness' – frequency of visits at the individual sites, when "travelling" along the shortest connection between each pair of nodes within the network (from high to low traffic: black, red, green, blue.)