Important news about the threat to the Dept of Archaeology at the University of Sheffield... Read more...

ArchAtlas was the inspired creation of Professor Andrew Sherratt. Its origins lay in thirty years of research and teaching in world archaeology. The web site started as a small pilot project in 2000, making use of new technologies, to provide an outlet for ideas which could not be expressed in other media. Much of the initial content, images and text were created by Andrew or under his direction, from the cited sources, and reflected his opinions about the topics under discussion. The “visual essays” listed below are those written by Andrew before his untimely death in 2006, or solicited by him from other authors.


Global View: A framework for expansion
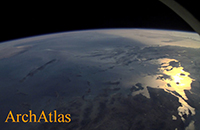
How to organise a global view of archaeology? The aim of this website is to provide maps and imagery which complement our understanding of the ancient world, and suggest new approaches to it...

Why an electronic atlas of archaeology?

When astronauts first took photographs of Earth from space, it transformed traditional images of the planet. Here, for the first time, were photographs of the world as it actually is. Systematic use of this information was at first confined to military objectives, but nowadays these images are familiar, as the backdrop to news items and weather forecasts. Moreover, they are now available as continuous cover, and can themselves be used as maps. began in Oxford in 2000, as a means of making available the kinds of images and interpretations which are more easily disseminated through a website than by conventional paper publication.

Contagious Processes

Archaeologists have long recognised (though in practice tend to forget) the degree to which developments in one part of the world were affected by things happening elsewhere. These animated maps of the spread of farming and of urbanism are intended to show a fundamental aspect of long-term human history: the underlying patterns of concentric expansion which have characterised cultural change in the Holocene.

The Origins of Farming in South-West Asia

Satellite images provide a convenient means of understanding why early sites were chosen for settlement, and of visualising the routes that linked them. These two factors (location amongst critical resources, and position in wider networks) interacted with each other: oases were occupied both because of their local advantages, and also because they acted as stepping-stones on routes carrying desirable materials over long distances. This presentation applies these arguments to a critical problem in prehistoric archaeology: where precisely did farming first emerge in western Asia?

Trade Routes: Growth of Global Trade

One of the most evident features of the human past is the growing scale of connections between areas, shown for instance by the movement of materials (such as the Obsidian Trade). Although the current phase of "globalisation" is unique in its range and impact, it was preceded by many earlier episodes of expansion and collapse. These maps reconstruct how such networks develop, and show how they follow a logic reflecting both their own geometry and that of the Earth's surface, and how they sometimes come to a catastrophic stop.

The Obsidian Trade in the Near East, 14,000 to 6500 BC

Obsidian, a black volcanic glass, was first recognized by Colin Renfrew and his colleagues J.E. Dixon and J.R. Cann in the 1960s as a uniquely sensitive indicator of prehistoric trade, both because of the great desirability of this material before the use of metals, and also because the trace-elements it contains are usually diagnostic of individual sources. Based on data extracted from M.-C. Cauvin et al., L'obsidienne au Proche et Moyen Orient: du volcan à l'outil (Oxford: BAR Int. Ser. 738), maps indicate the flows of material from two major source-areas.

Exploring Routes and Plains in Southwest Iran

Satellite imaging has given a new dimension to fieldwork in the varied terrain of Southwestern Iran, where the Zagros mountains separate the Mesopotamian lowlands from highland Iran, and whose successive ridges enclose fertile intermontane valleys. These fertile enclaves were often settled as early as the Neolithic, and have a continuous history of occupation down to the present day. They gained a historical importance as stepping stones on routes through the mountains (both for transhumance and trade), and as nodal points in the formation of political units.

Portages

Early trading networks carried relatively small quantities of valuable goods, often over considerable distances, both by land and water. The relationship between overland transport and carriage by river or sea helps to explain why trading centres rose to prominence at certain key positions on these routes. With very small quantities of goods, light vessels might be carried over short distances between rivers; and even when the bulk of traded goods increased, it might still be advantageous to carry the goods for short distances overland from one port to another. Sites at such break-of-bulk points became major nodes in the transport network. This presentation explores the changing geometry of early trade-routes, and especially the interface between land and sea.

East-West Contacts in Eurasia

Connections between the eastern and western ends of Eurasia began in the Bronze Age: China and the West co-evolved. A global viewpoint shows how this happened, first across the forests of Siberia, then by the steppes and oases of the Silk Road, then increasingly by sea, via the Indian Ocean. This is a human story of cultural encounter, exchange and creativity – and, ultimately, geo-economics.

Environmental Change: The evolution of Mesopotamia

The areas that were occupied by early farmers and town-dwellers were often very different from the landscapes that can be seen in the same areas today. Some of the most important changes took place in the great river basins where urban civilisation first emerged. Southern Mesopotamia (Iraq), the land of the two rivers, has been transformed over the last six thousand years by the changing relationships between rivers, land and sea. Although the pattern has not yet been reconstructed in detail, satellite imagery can be used to outline the major processes of change, and to visualise what an extraordinary landscape this was at the time of the first cities.

Tellspotting

How do we know where sites are? In the arc from south-east Europe to north-west India, early farming sites often form prominent mounds (known from the Arabic term as tell settlements). Such sites were often occupied over many millennia, and some of them grew into major cities during the Bronze Age; though thereafter settlement tended to shift to new locations away from the mounds. These early settlement-mounds form characteristic features of the landscape, and in fact are visible from space. Release of data from the Shuttle Radar Topography Mission in 2000 has provided the opportunity to identify the positions of many known archaeological sites of this type and to recognise others. Tellspotting is now not only an agreeable hobby, but has a high-tech methodology: an invaluable tool in reconstructing settlement-history and a means of inventorizing these outstanding sources of archaeological information.

Virtual Survey: a semi-automated tellspotting algorithm

Following the observation that prehistoric and early historic settlement-mounds (tell settlements) in parts of the Near and Middle East can be recognized in the SRTM 90m terrain model (Sherratt, Antiquity 2004) an algorithm has been developed to do this automatically, using current techniques of computer modeling.

Culture Areas in Western Eurasia 20,000-3250BC

Prehistoric archaeologists have some weird labels for their material, naming cultural groups after the sites where they were first recognised, or after their most characteristic artefacts. These make a whole lot more sense when plotted on maps, period by period, so that patterns of cultural similarity, and connection become apparent. Do 'cultures' exist? I don't know, but if archaeologists use them in their everyday work, it makes sense to know where they are, or are thought to be.

Sites and Landscapes in 3D

If we have elevation data (conventionally represented by contour-lines) and satellite imagery, why not combine the two? This allows a site to be represented not just in a vertical view, but as it is seen from different viewpoints. Why not combine them all, so that it can be examined from all angles, flown over, walked through? These are some examples of famous areas and sites. A hint of the future, when such representations will be routine.

Panoramas

The resolution of satellite-imagery in the public domain is constantly improving. Although images with the resolution hitherto obtainable by aerial photographs are still expensive, imagery with a resolution of 15m or better is routinely available for most parts of the world, thanks principally to NASA. For some areas, this is already better than most maps. It is especially useful in areas with strong vegetational contrasts depending on water-sources. Selected key sites are presented here, as they can be seen from space.